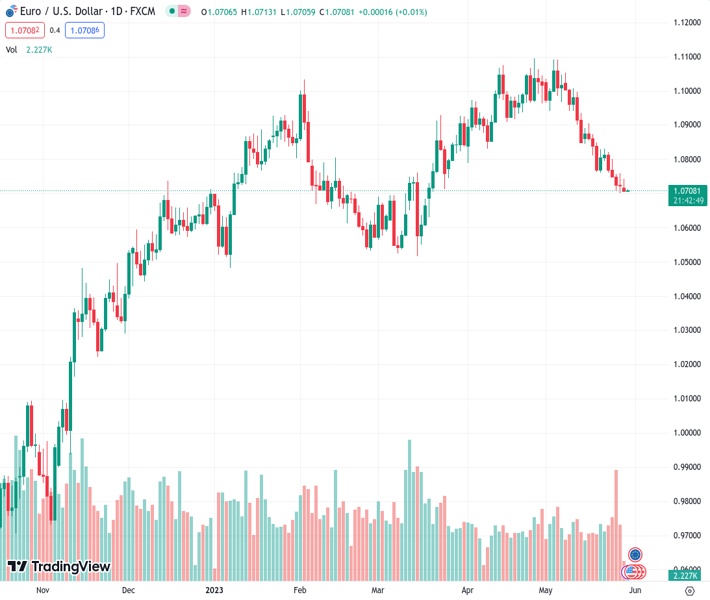
#EURUSD @ 1.07082 stays pressured at the lowest levels in 10 weeks. (Pivot Orderbook analysis)
…
This is a premium post.
[s2If !current_user_can(access_s2member_level4)]Please register for FREE REGISTER to read full post below containing analysis. In case of any error or you think you are not able to read the full post below, please email us at support#nehcap.com [lwa][/s2If] [s2If current_user_can(access_s2member_level1)]
- EUR/USD stays pressured at the lowest levels in 10 weeks.
- Political turmoil in Spain, unimpressive ECB talks and fears of German recession weigh on Euro.
- Risks surrounding US debt-ceiling agreement’s passage through Congress, hawkish Fed bets also favor bears.
- Mid-tier EU/US data, developments
- about efforts to avoid US default will be eyed for intraday directions.
The pair currently trades last at 1.07082.
The previous day high was 1.0759 while the previous day low was 1.0702. The daily 38.2% Fib levels comes at 1.0724, expected to provide resistance. Similarly, the daily 61.8% fib level is at 1.0737, expected to provide resistance.
EUR/USD bears flirt with the 1.0700 threshold as full markets return on Tuesday, after Monday’s holiday in multiple bourses. The Euro pair’s latest weakness could be linked to the fresh challenges to sentiment, as well as comparatively less hawkish bets on the European Central Bank (ECB) than the Federal Reserve (Fed).
Despite the sluggish start of the week, due to holidays in major markets, the political turmoil in Spain joined doubts about the ECB’s capacity to extend its hawkish run to weigh n the EUR/USD price.
On Monday, Spanish Prime Minister (PM) Pedro Sanchez announced snap elections in July while Greek President is up for appointing a caretaker PM ahead of a repeat election on June 25. Additionally, the last week’s downward revision to Germany’s first quarter (Q1) Gross Domestic Product (GDP) figures renewed recession fears in the bloc and weigh on the EUR/USD prices.
Even so, ECB Policymaker Pierre Wunsch said on Saturday, “We hiked 400bp and we might have to do more.”
On the other hand, market sentiment improved after the US policymakers sealed the deal to avoid the US default. However, the agreement’s passage through Congress is a concern amid dissatisfaction with the compromises cited to reach the deal.
Elsewhere, upbeat prints of the US PMIs, Durable Goods Orders and Q1 GDP and inflation signals underpin hawkish bias about the Fed despite expectations that the debt ceiling deal pushes the government for mode bond issuance and exhaust liquidity from the markets.
With this, the European yields edge lower while the equities grind higher and the US Dollar takes a breather around a multi-day high.
Moving on, Eurozone Consumer Confidence and second-tier housing data from the US will join the US CB Consumer Confidence to entertain the EUR/USD traders. Though, developments about the US debt ceiling agreement and clues for the Eurozone inflation will be the key to watching for a clear guide.
Also read: US Consumer Confidence Preview: Confidence remains down, but DXY aims up
EUR/USD struggles between a one-month-old descending resistance line and an upward-sloping support line from late November 2022, respectively near 1.0725 and 1.0700, amid sluggish markets. However, the nearly oversold RSI (14) signals the recovery of the Euro pair.
Even if the quote breaks the 1.0700 immediate support, the 200-day Exponential Moving Average (EMA) of around 1.0685 can act as an additional downside filter to challenge the bears before giving them control.
Technical Levels: Supports and Resistances
EURUSD currently trading at 1.071 at the time of writing. Pair opened at 1.0725 and is trading with a change of -0.14% % .
| Overview | Overview.1 | |
|---|---|---|
| 0 | Today last price | 1.071 |
| 1 | Today Daily Change | -0.0015 |
| 2 | Today Daily Change % | -0.14% |
| 3 | Today daily open | 1.0725 |
The pair is trading below its 20 Daily moving average @ 1.0886, below its 50 Daily moving average @ 1.0904 , below its 100 Daily moving average @ 1.0816 and above its 200 Daily moving average @ 1.0483
| Trends | Trends.1 | |
|---|---|---|
| 0 | Daily SMA20 | 1.0886 |
| 1 | Daily SMA50 | 1.0904 |
| 2 | Daily SMA100 | 1.0816 |
| 3 | Daily SMA200 | 1.0483 |
The previous day high was 1.0759 while the previous day low was 1.0702. The daily 38.2% Fib levels comes at 1.0724, expected to provide resistance. Similarly, the daily 61.8% fib level is at 1.0737, expected to provide resistance.
Note the levels of interest below:
- Pivot support is noted at 1.0698, 1.0671, 1.0641
- Pivot resistance is noted at 1.0755, 1.0785, 1.0812
| Levels | Levels.1 |
|---|---|
| Previous Daily High | 1.0759 |
| Previous Daily Low | 1.0702 |
| Previous Weekly High | 1.0831 |
| Previous Weekly Low | 1.0702 |
| Previous Monthly High | 1.1095 |
| Previous Monthly Low | 1.0788 |
| Daily Fibonacci 38.2% | 1.0724 |
| Daily Fibonacci 61.8% | 1.0737 |
| Daily Pivot Point S1 | 1.0698 |
| Daily Pivot Point S2 | 1.0671 |
| Daily Pivot Point S3 | 1.0641 |
| Daily Pivot Point R1 | 1.0755 |
| Daily Pivot Point R2 | 1.0785 |
| Daily Pivot Point R3 | 1.0812 |
[/s2If]
Nehcap Expert Advisor
The NEHCAP MT4 EA is high quality professional trading system geared to generate returns without using GRID or martingales. Each trade has strict risk per trade parameter. The pairs under management include EURUSD, GBPUSD, AUDCAD, AUDNZD,GBPAUD, EURAUD, EURCAD, CHFJPY and many more.
The system is trading live: LIVE ACCOUNT TRACKING
You can run it free. Apply for a free trial and track our account. Buy the system or use profit share mechanism to generate returns on your MT4.
Join Our Telegram Group


