#EURUSD @ 1.07913 drops to new lows near 1.0750 on Wednesday. (Pivot Orderbook analysis)
…
This is a premium post.
[s2If !current_user_can(access_s2member_level4)]Please register for FREE REGISTER to read full post below containing analysis. In case of any error or you think you are not able to read the full post below, please email us at support#nehcap.com [lwa][/s2If] [s2If current_user_can(access_s2member_level1)]
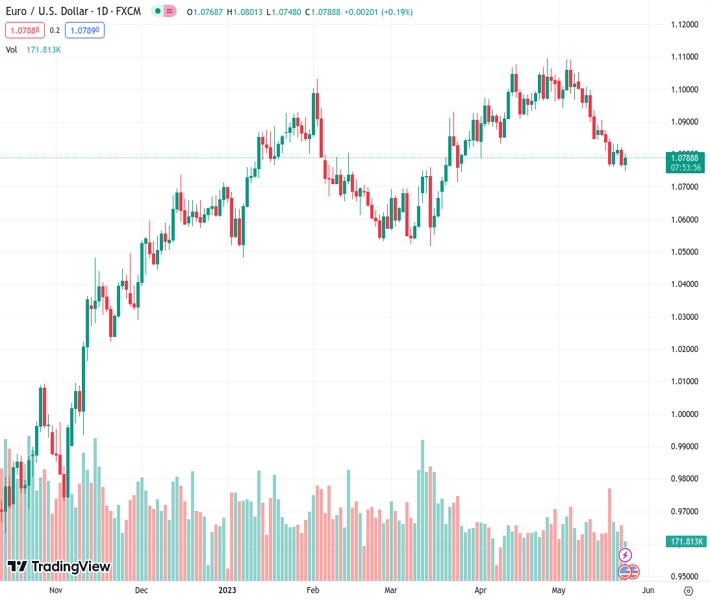
- EUR/USD drops to new lows near 1.0750 on Wednesday.
- Further selling could revisit the minor level at 1.0712.
The pair currently trades last at 1.07913.
The previous day high was 1.082 while the previous day low was 1.076. The daily 38.2% Fib levels comes at 1.0783, expected to provide support. Similarly, the daily 61.8% fib level is at 1.0798, expected to provide resistance.
EUR/USD manages well to reverse the initial knee-jerk to fresh 2-month lows in the 1.0750/45 band midweek.
Despite the ongoing bounce and the apparent consolidative mood, the breach of the May low near 1.0750 could spark a deeper move to the minor support level at 1.0712 (March 24).
A deeper decline to the March bottom of 1.0516 (March 15), in the meantime, remains not favoured for the time being.
Looking at the longer run, the constructive view remains unchanged while above the 200-day SMA, today at 1.0474.
Technical Levels: Supports and Resistances
EURUSD currently trading at 1.0789 at the time of writing. Pair opened at 1.077 and is trading with a change of 0.18 % .
| Overview | Overview.1 | |
|---|---|---|
| 0 | Today last price | 1.0789 |
| 1 | Today Daily Change | 53.0000 |
| 2 | Today Daily Change % | 0.1800 |
| 3 | Today daily open | 1.0770 |
The pair is trading below its 20 Daily moving average @ 1.093, below its 50 Daily moving average @ 1.0897 , below its 100 Daily moving average @ 1.0812 and above its 200 Daily moving average @ 1.0473
| Trends | Trends.1 | |
|---|---|---|
| 0 | Daily SMA20 | 1.0930 |
| 1 | Daily SMA50 | 1.0897 |
| 2 | Daily SMA100 | 1.0812 |
| 3 | Daily SMA200 | 1.0473 |
The previous day high was 1.082 while the previous day low was 1.076. The daily 38.2% Fib levels comes at 1.0783, expected to provide support. Similarly, the daily 61.8% fib level is at 1.0798, expected to provide resistance.
Note the levels of interest below:
- Pivot support is noted at 1.0747, 1.0723, 1.0687
- Pivot resistance is noted at 1.0807, 1.0844, 1.0867
| Levels | Levels.1 |
|---|---|
| Previous Daily High | 1.0820 |
| Previous Daily Low | 1.0760 |
| Previous Weekly High | 1.0904 |
| Previous Weekly Low | 1.0760 |
| Previous Monthly High | 1.1095 |
| Previous Monthly Low | 1.0788 |
| Daily Fibonacci 38.2% | 1.0783 |
| Daily Fibonacci 61.8% | 1.0798 |
| Daily Pivot Point S1 | 1.0747 |
| Daily Pivot Point S2 | 1.0723 |
| Daily Pivot Point S3 | 1.0687 |
| Daily Pivot Point R1 | 1.0807 |
| Daily Pivot Point R2 | 1.0844 |
| Daily Pivot Point R3 | 1.0867 |
[/s2If]
Nehcap Expert Advisor
The NEHCAP MT4 EA is high quality professional trading system geared to generate returns without using GRID or martingales. Each trade has strict risk per trade parameter. The pairs under management include EURUSD, GBPUSD, AUDCAD, AUDNZD,GBPAUD, EURAUD, EURCAD, CHFJPY and many more.
The system is trading live: LIVE ACCOUNT TRACKING
You can run it free. Apply for a free trial and track our account. Buy the system or use profit share mechanism to generate returns on your MT4.
Join Our Telegram Group


