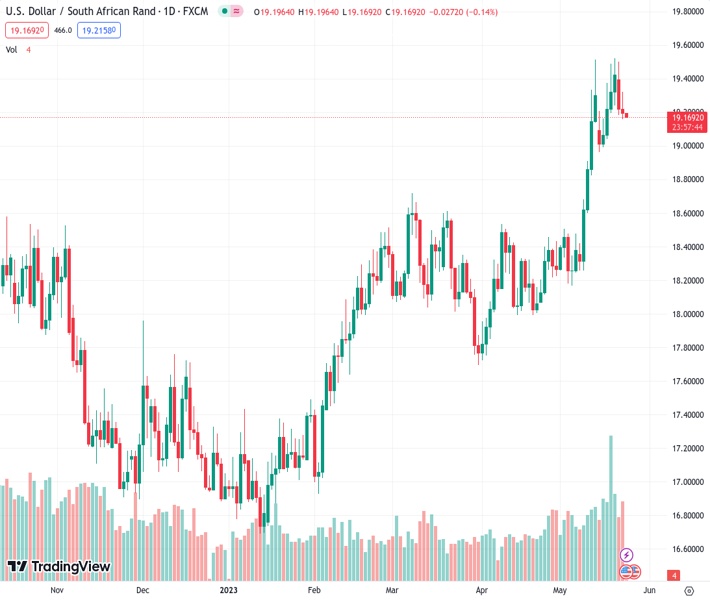
#USDZAR @ 19.1954 The is correcting lower after hitting record highs last week. (Pivot Orderbook analysis)
…
This is a premium post.
[s2If !current_user_can(access_s2member_level4)]Please register for FREE REGISTER to read full post below containing analysis. In case of any error or you think you are not able to read the full post below, please email us at support#nehcap.com [lwa][/s2If] [s2If current_user_can(access_s2member_level1)]
- The USD/ZAR is correcting lower after hitting record highs last week.
- The US Dollar rises on Tuesday across the board amid risk aversion, limiting the downside in the pair.
- Key events ahead: South African inflation, FOMC minutes and SARB interest rate decision.
The pair currently trades last at 19.1954.
The previous day high was 19.5032 while the previous day low was 19.206. The daily 38.2% Fib levels comes at 19.3195, expected to provide resistance. Similarly, the daily 61.8% fib level is at 19.3896, expected to provide resistance.
Despite a prevailing negative market outlook and a stronger US Dollar, the South African Rand (ZAR) has exhibited resilience by maintaining its position, supported by expectations of interest rate hikes by the South African Central Bank. The USD/ZAR pair declined to 19.16, reaching its lowest level since the previous Wednesday, before bouncing back to 19.20.
The US S&P Global/CIPS Manufacturing Purchasing Managers’ Index (PMI) unexpectedly contracted in May, dropping to 48.5, while market expectations were for a reading of 50. Conversely, the Services index surpassed predictions, rising to 55.1 compared to the anticipated 52.6.
The S&P 500 index (SPX) and the Nasdaq Composite both closed with declines of over 1%. The risk aversion sentiment bolstered the US Dollar, leading to a 0.30% climb in the DXY as it tested weekly highs.
On Wednesday, inflation data will be released in South Africa. Market consensus is for a modest slide in the annual inflation rate from 7.1% to 7.0% and the Core Consumer Price Index to rise from 5.2% to 5.3%.
The South African Reserve Bank (SARB) will announce its monetary policy decision on Thursday. There is an expectation of a 25 basis points rate hike, raising the interest rate from 7.75% to 8.00%. However, there are also risks of a larger rate increase, which has supported the Rand.
After surging to 19.51 on Friday, the USD/ZAR started to correct lower. The correction found support above 19.15. On the 4-hour chart, the pair remains below a bearish 20-period Simple Moving Average, currently at 19.30. If it rises above this level, it could potentially test 19.50 again.
On the flip side, below Tuesday’s low at 19.15, the next support level is seen at 19.10, followed by 18.99 (May 15, 16 low).
Technical Levels: Supports and Resistances
USDZAR currently trading at 19.2054 at the time of writing. Pair opened at 19.2246 and is trading with a change of -0.1 % .
| Overview | Overview.1 | |
|---|---|---|
| 0 | Today last price | 19.2054 |
| 1 | Today Daily Change | -0.0192 |
| 2 | Today Daily Change % | -0.1000 |
| 3 | Today daily open | 19.2246 |
The pair remains strongly bullish on the daily timeframe. It trades above its 20 SMA @ 18.7478, 50 SMA 18.4148, 100 SMA @ 18.0304 and 200 SMA @ 17.7715.
| Trends | Trends.1 | |
|---|---|---|
| 0 | Daily SMA20 | 18.7478 |
| 1 | Daily SMA50 | 18.4148 |
| 2 | Daily SMA100 | 18.0304 |
| 3 | Daily SMA200 | 17.7715 |
The previous day high was 19.5032 while the previous day low was 19.206. The daily 38.2% Fib levels comes at 19.3195, expected to provide resistance. Similarly, the daily 61.8% fib level is at 19.3896, expected to provide resistance.
Note the levels of interest below:
- Pivot support is noted at 19.1193, 19.0141, 18.8222
- Pivot resistance is noted at 19.4165, 19.6084, 19.7136
| Levels | Levels.1 |
|---|---|
| Previous Daily High | 19.5032 |
| Previous Daily Low | 19.2060 |
| Previous Weekly High | 19.5250 |
| Previous Weekly Low | 18.9943 |
| Previous Monthly High | 18.5399 |
| Previous Monthly Low | 17.7526 |
| Daily Fibonacci 38.2% | 19.3195 |
| Daily Fibonacci 61.8% | 19.3896 |
| Daily Pivot Point S1 | 19.1193 |
| Daily Pivot Point S2 | 19.0141 |
| Daily Pivot Point S3 | 18.8222 |
| Daily Pivot Point R1 | 19.4165 |
| Daily Pivot Point R2 | 19.6084 |
| Daily Pivot Point R3 | 19.7136 |
[/s2If]
Nehcap Expert Advisor
The NEHCAP MT4 EA is high quality professional trading system geared to generate returns without using GRID or martingales. Each trade has strict risk per trade parameter. The pairs under management include EURUSD, GBPUSD, AUDCAD, AUDNZD,GBPAUD, EURAUD, EURCAD, CHFJPY and many more.
The system is trading live: LIVE ACCOUNT TRACKING
You can run it free. Apply for a free trial and track our account. Buy the system or use profit share mechanism to generate returns on your MT4.
Join Our Telegram Group


