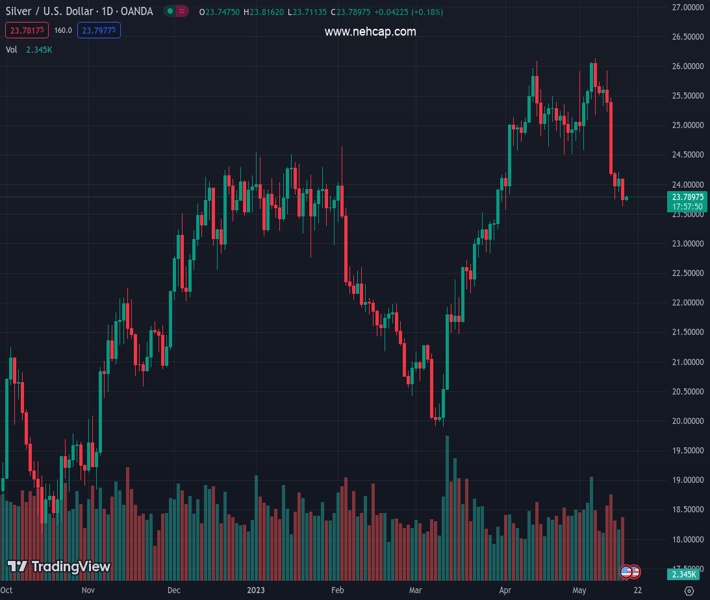
#XAGUSD @ 23.795 Silver price licks its wounds at the lowest levels in six weeks., @nehcap view: Limited downside expected (Pivot Orderbook analysis)
…
This is a premium post.
[s2If !current_user_can(access_s2member_level4)]Please register for FREE REGISTER to read full post below containing analysis. In case of any error or you think you are not able to read the full post below, please email us at support#nehcap.com [lwa][/s2If] [s2If current_user_can(access_s2member_level1)]
- Silver price licks its wounds at the lowest levels in six weeks.
- Daily closing below 50-DMA, bearish MACD signals keep XAG/USD sellers hopeful.
- 100-DMA, nearly oversold RSI (14) line can restrict Silver Price downside.
The pair currently trades last at 23.795.
The previous day high was 24.11 while the previous day low was 23.64. The daily 38.2% Fib levels comes at 23.82, expected to provide resistance. Similarly, the daily 61.8% fib level is at 23.93, expected to provide resistance.
Silver price (XAG/USD) remains mildly bid around $23.75-80 as it pares the biggest daily loss in a week at a 1.5-month low, marked the previous day, amid early Wednesday in Europe.
Despite the latest inaction, or say a short-covering move, the XAG/USD remains on the bear’s radar as it keeps Tuesday’s closing breakdown of the 50-DMA. Adding strength to the Silver Price downside bias are the bearish MACD signals.
With this, the XAG/USD is well-set to drop test the 100-DMA support of near $23.40 before poking the 50% Fibonacci retracement level of its March-May upside, close to the $23.00 round figure.
It’s worth noting, however, that the RSI (14) line is near to the oversold territory and hence suggests bottom-picking of the XAG/USD around the aforementioned supports.
Should the Silver price drop below $23.00, the 61.8% Fibonacci retracement level, also known as the golden Fibonacci ratio, can challenge the XAG/USD bears near $22.30.
On the contrary, recovery moves need validation from the 50-DMA hurdle surrounding $24.10.
Even if the Silver price manages to provide a daily closing beyond $24.10, a horizontal area comprising levels marked since late March, around $24.20, can act as an extra filter towards the north before welcoming the XAG/USD bulls.
Following that, multiple levels marked during the April-May period, around $24.50-55, can act as the last defense of the XAG/USD bears.
Trend: Limited downside expected
Technical Levels: Supports and Resistances
XAGUSD currently trading at 23.77 at the time of writing. Pair opened at 23.76 and is trading with a change of 0.04% % .
| Overview | Overview.1 | |
|---|---|---|
| 0 | Today last price | 23.77 |
| 1 | Today Daily Change | 0.01 |
| 2 | Today Daily Change % | 0.04% |
| 3 | Today daily open | 23.76 |
The pair is trading below its 20 Daily moving average @ 25.05, below its 50 Daily moving average @ 23.98 , above its 100 Daily moving average @ 23.4 and above its 200 Daily moving average @ 21.89
| Trends | Trends.1 | |
|---|---|---|
| 0 | Daily SMA20 | 25.05 |
| 1 | Daily SMA50 | 23.98 |
| 2 | Daily SMA100 | 23.40 |
| 3 | Daily SMA200 | 21.89 |
The previous day high was 24.11 while the previous day low was 23.64. The daily 38.2% Fib levels comes at 23.82, expected to provide resistance. Similarly, the daily 61.8% fib level is at 23.93, expected to provide resistance.
Note the levels of interest below:
- Pivot support is noted at 23.56, 23.36, 23.09
- Pivot resistance is noted at 24.03, 24.3, 24.5
| Levels | Levels.1 |
|---|---|
| Previous Daily High | 24.11 |
| Previous Daily Low | 23.64 |
| Previous Weekly High | 25.92 |
| Previous Weekly Low | 23.74 |
| Previous Monthly High | 26.09 |
| Previous Monthly Low | 23.57 |
| Daily Fibonacci 38.2% | 23.82 |
| Daily Fibonacci 61.8% | 23.93 |
| Daily Pivot Point S1 | 23.56 |
| Daily Pivot Point S2 | 23.36 |
| Daily Pivot Point S3 | 23.09 |
| Daily Pivot Point R1 | 24.03 |
| Daily Pivot Point R2 | 24.30 |
| Daily Pivot Point R3 | 24.50 |
[/s2If]
Nehcap Expert Advisor
The NEHCAP MT4 EA is high quality professional trading system geared to generate returns without using GRID or martingales. Each trade has strict risk per trade parameter. The pairs under management include EURUSD, GBPUSD, AUDCAD, AUDNZD,GBPAUD, EURAUD, EURCAD, CHFJPY and many more.
The system is trading live: LIVE ACCOUNT TRACKING
You can run it free. Apply for a free trial and track our account. Buy the system or use profit share mechanism to generate returns on your MT4.
Join Our Telegram Group


