#XAUUSD @ 1,988.73 Gold Price breaks short-term key supports as bears cheer firmer US Dollar., @nehcap view: Recovery expected (Pivot Orderbook analysis)
…
This is a premium post.
[s2If !current_user_can(access_s2member_level4)]Please register for FREE REGISTER to read full post below containing analysis. In case of any error or you think you are not able to read the full post below, please email us at support#nehcap.com [lwa][/s2If] [s2If current_user_can(access_s2member_level1)]
- Gold Price breaks short-term key supports as bears cheer firmer US Dollar.
- Hopes of United States debt limit extension, upbeat US data and hawkish Federal Reserve talks weigh on XAU/USD.
- S&P500 Futures remain depressed tracing downbeat Wall Street performance, Treasury bond yields rise amid risk-off mood.
- Risk catalysts will be the key to follow for the Gold price predictions.
The pair currently trades last at 1988.73.
The previous day high was 2022.18 while the previous day low was 2007.36. The daily 38.2% Fib levels comes at 2016.52, expected to provide resistance. Similarly, the daily 61.8% fib level is at 2013.02, expected to provide resistance.
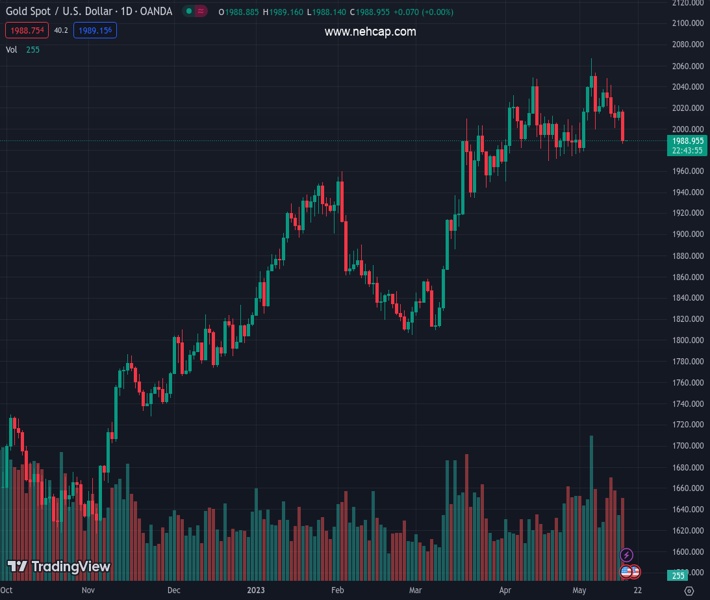
Gold Price (XAU/USD) holds lower grounds at a two-week bottom surrounding $1,990 early Wednesday, after breaking the key short-term support lines during the previous day’s fall. That said, the yellow metal bears the burden of the strong US Dollar, as well as upbeat United States data, while failing to justify the optimism surrounding the US debt limit extension.
Gold price broke important supports and marked the biggest daily loss in nearly a fortnight as the US Dollar Index (DXY) remains firmer despite the recent relief in the risk markets due to the receding fears of the United States default. The reason for the DXY run-up could be linked to the strong US data and the hawkish Federal Reserve (Fed) commentary.
Recently, Reuters reported that the Democratic President Joe Biden and top congressional Republican Kevin McCarthy’s US debt ceiling negotiations ended on Tuesday after less than an hour, as the looming fear of an unprecedented American debt default prompted Biden to cut short an upcoming Asia trip. The news also mentioned that the meeting ended on an upbeat and unexpected note as McCarthy, coming out of the meeting with Biden and other congressional leaders, said, “It is possible to get a deal by the end of the week.”
On Tuesday, US Retail Sales improved to 0.4% MoM for April, from -0.7% prior (revised) versus 0.7% expected. More importantly, Retail Sales Control Group for the said month crossed market forecasts of 0.0% and -0.4% prior with 0.7% actual figure wheras Retail Sales ex Autos matches 0.4% MoM estimations for April¸ surpassing the -0.5% prior. Further, the US Industrial Production MoM rose to 0.5% for April versus expectations of printing 0.0% figure.
It should be noted that Richmond Fed Thomas Barkin said in an interview with the Financial Times (FT) that if inflation persists, or God forbid accelerates, there’s no barrier in my mind to further increases in rates. On the same line, Cleveland Fed President Loretta Mester said, “I don’t think we’re at that hold rate yet.”
Amid these plays, the US Treasury bond yields remained firmer and Wall Street witnessed losses on Tuesday, which in turn allowed the US Dollar to cheer the haven demand. As a result, the Gold price remained pressured.
Apart from what’s already mentioned above, downbeat data from China, one of the world’s biggest Gold consumers, also weigh on the XAU/USD price. Additionally, fears of more West versus Russia tension and the US-China tussles exert more downside pressure on the Gold price.
Gold price remain well below an eight-day-old horizontal support around $2,000, as well as an upward-sloping support line from late March, close to $1,993 by the press time, suggesting the bear’s dominance.
It’s worth noting that the bearish signals from the Moving Average Convergence and Divergence (MACD) indicator teases sellers but the lower lows on the Relative Strength Index (RSI), placed at 14, hints at limited downside room.
As a result, the XAU/USD sellers might want to wait for a clear downside break of the 50-DMA support of $1,982 for conviction.
Meanwhile, the Gold price corrective bounce needs validation from the aforementioned support-turned-resistances around $1,993 and $2,000 before recalling the XAU/USD bulls targeting a five-week-old horizontal resistance area surrounding $2,050.
Following that, the latest all-time high of around $2,080 and the $2,100 round figure will be on the radars of the XAU/USD bulls.
Overall, the Gold price remains on the seller’s desk but a sustained downside break of $1,982 becomes necessary to convince bears.
Trend: Recovery expected
Technical Levels: Supports and Resistances
XAUUSD currently trading at 1989.22 at the time of writing. Pair opened at 2016.46 and is trading with a change of -1.35% % .
| Overview | Overview.1 | |
|---|---|---|
| 0 | Today last price | 1989.22 |
| 1 | Today Daily Change | -27.24 |
| 2 | Today Daily Change % | -1.35% |
| 3 | Today daily open | 2016.46 |
The pair is trading below its 20 Daily moving average @ 2008.72, above its 50 Daily moving average @ 1975.65 , above its 100 Daily moving average @ 1922.14 and above its 200 Daily moving average @ 1822.15
| Trends | Trends.1 | |
|---|---|---|
| 0 | Daily SMA20 | 2008.72 |
| 1 | Daily SMA50 | 1975.65 |
| 2 | Daily SMA100 | 1922.14 |
| 3 | Daily SMA200 | 1822.15 |
The previous day high was 2022.18 while the previous day low was 2007.36. The daily 38.2% Fib levels comes at 2016.52, expected to provide resistance. Similarly, the daily 61.8% fib level is at 2013.02, expected to provide resistance.
Note the levels of interest below:
- Pivot support is noted at 2008.49, 2000.51, 1993.67
- Pivot resistance is noted at 2023.31, 2030.15, 2038.13
| Levels | Levels.1 |
|---|---|
| Previous Daily High | 2022.18 |
| Previous Daily Low | 2007.36 |
| Previous Weekly High | 2048.27 |
| Previous Weekly Low | 2000.95 |
| Previous Monthly High | 2048.75 |
| Previous Monthly Low | 1949.83 |
| Daily Fibonacci 38.2% | 2016.52 |
| Daily Fibonacci 61.8% | 2013.02 |
| Daily Pivot Point S1 | 2008.49 |
| Daily Pivot Point S2 | 2000.51 |
| Daily Pivot Point S3 | 1993.67 |
| Daily Pivot Point R1 | 2023.31 |
| Daily Pivot Point R2 | 2030.15 |
| Daily Pivot Point R3 | 2038.13 |
[/s2If]
Nehcap Expert Advisor
The NEHCAP MT4 EA is high quality professional trading system geared to generate returns without using GRID or martingales. Each trade has strict risk per trade parameter. The pairs under management include EURUSD, GBPUSD, AUDCAD, AUDNZD,GBPAUD, EURAUD, EURCAD, CHFJPY and many more.
The system is trading live: LIVE ACCOUNT TRACKING
You can run it free. Apply for a free trial and track our account. Buy the system or use profit share mechanism to generate returns on your MT4.
Join Our Telegram Group


