Asian stocks are showing overall strength as the Fed is expected to pause the rate-hike spell. (Pivot Orderbook analysis)
…
This is a premium post.
[s2If !current_user_can(access_s2member_level4)]Please register for FREE REGISTER to read full post below containing analysis. In case of any error or you think you are not able to read the full post below, please email us at support#nehcap.com [lwa][/s2If] [s2If current_user_can(access_s2member_level1)]
- Asian stocks are showing overall strength as the Fed is expected to pause the rate-hike spell.
- Japanese stocks have hogged the limelight after positive commentary from Japan’s Prime Minister Fumio Kishida.
- Better China’s property sector outlook has infused strength in its equity domain.
The pair currently trades last at 29649.56.
The previous day high was 29565.5 while the previous day low was 29238.24. The daily 38.2% Fib levels comes at 29440.49, expected to provide support. Similarly, the daily 61.8% fib level is at 29363.25, expected to provide support.
Markets in the Asian domain are showing all-recovery strength as expectations for a pause in the policy-tightening spell by the Federal Reserve (Fed) are skyrocketing. The street is anticipating that Fed chair Jerome Powell will halt the rate-hike cycle to avoid the United States recession. Also, declining US inflation and Producer Price Index (PPI), and easing labor market conditions are supporting the context.
At the press time, Japan’s Nikkei225 jumps 0.73%, ChinaA50 climbs 0.70%, Hang Seng soared 2.19%, and Nifty50 gained 0.54%.
Japanese stocks have hogged the limelight after positive commentary from Japan’s Prime Minister Fumio Kishida. Japan’s PMI cited “We will endeavor to pull Japan out of deflation and attain private demand-driven economic growth.” Apart from that, Japan’s PM highlighted the need for the government and the Bank of Japan (BoJ) to closely coordinate for increasing economic policy. Also, Goldman Sachs stated solid fundamentals and expectations for structural changes justify a bullish stance on Japan’s equities.
Chinese equities are performing stronger as the economy is battling with the real estate crisis effectively. Meanwhile, Moody’s has changed China’s property sector outlook to stable from negative on better sales and funding conditions. This has infused fresh blood into Chinese stocks. Going forward, China’s annual Retail Sales data will remain in the spotlight. April’s Retail Sales data is seen expanding by 20.1% vs. the prior release of 10.6%.
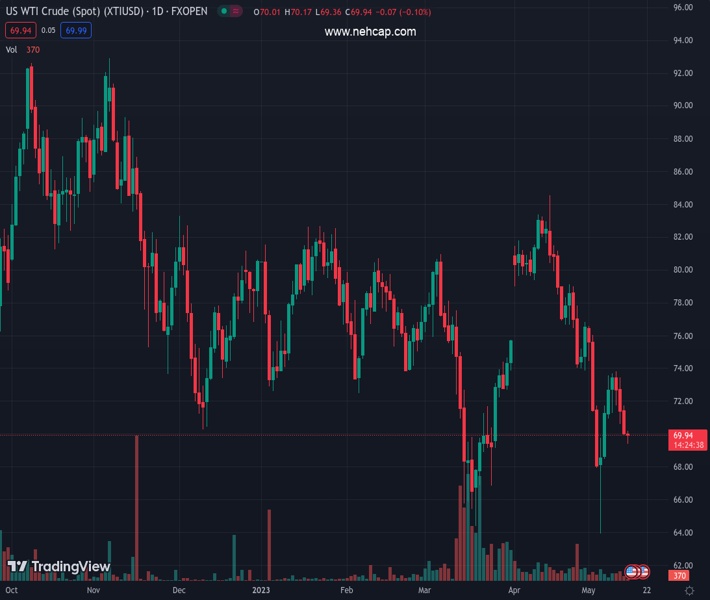
On the oil front, oil prices have recovered strongly to near $70.00 on hopes that a stable interest rate policy by the Fed will trigger the oil demand.
Technical Levels: Supports and Resistances
XTIUSD currently trading at 29649.56 at the time of writing. Pair opened at 29560.59 and is trading with a change of 0.3 % .
| Overview | Overview.1 | |
|---|---|---|
| 0 | Today last price | 29649.56 |
| 1 | Today Daily Change | 88.97 |
| 2 | Today Daily Change % | 0.30 |
| 3 | Today daily open | 29560.59 |
The pair remains strongly bullish on the daily timeframe. It trades above its 20 SMA @ 28825.23, 50 SMA 28191.29, 100 SMA @ 27591.4 and 200 SMA @ 27612.61.
| Trends | Trends.1 | |
|---|---|---|
| 0 | Daily SMA20 | 28825.23 |
| 1 | Daily SMA50 | 28191.29 |
| 2 | Daily SMA100 | 27591.40 |
| 3 | Daily SMA200 | 27612.61 |
The previous day high was 29565.5 while the previous day low was 29238.24. The daily 38.2% Fib levels comes at 29440.49, expected to provide support. Similarly, the daily 61.8% fib level is at 29363.25, expected to provide support.
Note the levels of interest below:
- Pivot support is noted at 29344.05, 29127.52, 29016.79
- Pivot resistance is noted at 29671.31, 29782.04, 29998.57
| Levels | Levels.1 |
|---|---|
| Previous Daily High | 29565.50 |
| Previous Daily Low | 29238.24 |
| Previous Weekly High | 29565.50 |
| Previous Weekly Low | 28875.33 |
| Previous Monthly High | 29058.52 |
| Previous Monthly Low | 27562.51 |
| Daily Fibonacci 38.2% | 29440.49 |
| Daily Fibonacci 61.8% | 29363.25 |
| Daily Pivot Point S1 | 29344.05 |
| Daily Pivot Point S2 | 29127.52 |
| Daily Pivot Point S3 | 29016.79 |
| Daily Pivot Point R1 | 29671.31 |
| Daily Pivot Point R2 | 29782.04 |
| Daily Pivot Point R3 | 29998.57 |
[/s2If]
Nehcap Expert Advisor
The NEHCAP MT4 EA is high quality professional trading system geared to generate returns without using GRID or martingales. Each trade has strict risk per trade parameter. The pairs under management include EURUSD, GBPUSD, AUDCAD, AUDNZD,GBPAUD, EURAUD, EURCAD, CHFJPY and many more.
The system is trading live: LIVE ACCOUNT TRACKING
You can run it free. Apply for a free trial and track our account. Buy the system or use profit share mechanism to generate returns on your MT4.
Join Our Telegram Group


