#NZDUSD @ 0.62192 recovers from three-week-old horizontal support area to snap two-day downtrend., @nehcap view: Limited upside expected (Pivot Orderbook analysis)
…
This is a premium post.
[s2If !current_user_can(access_s2member_level4)]Please register for FREE REGISTER to read full post below containing analysis. In case of any error or you think you are not able to read the full post below, please email us at support#nehcap.com [lwa][/s2If] [s2If current_user_can(access_s2member_level1)]
- NZD/USD recovers from three-week-old horizontal support area to snap two-day downtrend.
- Oversold RSI (14) line favors corrective bounce but convergence of 200-SMA, 50% Fibonacci retracement guards immediate upside.
- Multiple hurdles toward the north, bearish MACD signals prod Kiwi pair buyers.
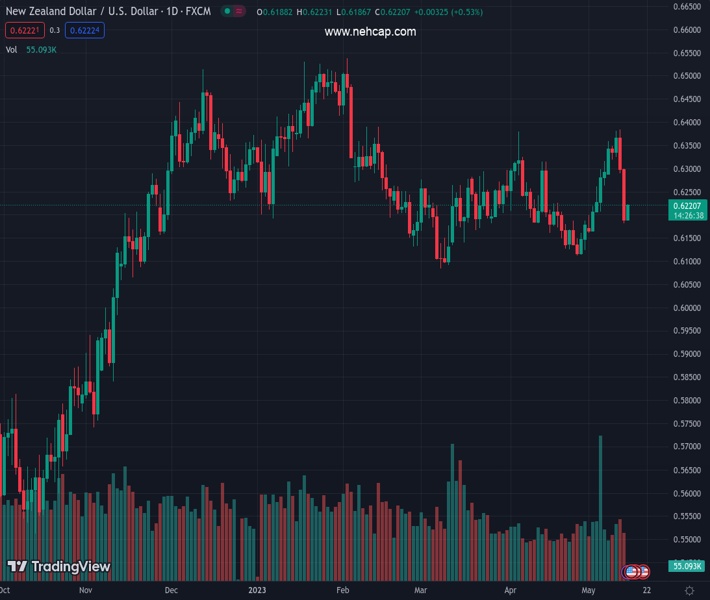
The pair currently trades last at 0.62192.
The previous day high was 0.6311 while the previous day low was 0.6182. The daily 38.2% Fib levels comes at 0.6231, expected to provide resistance. Similarly, the daily 61.8% fib level is at 0.6262, expected to provide resistance.
NZD/USD pares the biggest weekly gain since late January as it picks up bids to refresh its intraday high near 0.6220 heading into Monday’s European session. In doing so, the Kiwi pair takes a U-turn from three-week-long horizontal support, amid an oversold RSI (14) line, to print the first daily run-up in three.
That said, the quote’s latest rebound pushes back the NZD/USD prices above the 61.8% Fibonacci retracement of its March-April upside.
However, a convergence of the 200-SMA and 50% Fibonacci retracement, near 0.6230-35, guards the NZD/USD pair’s immediate upside.
Following that, a quick run-up towards the 38.2% Fibonacci retracement level of near 0.6270 can’t be ruled out. Though, the 0.6300 and mid-April high of around 0.6315 could challenge the Kiwi pair’s further advances before directing the bulls towards the yearly top marked the last month around 0.6385.
On the other hand, a daily closing below the aforementioned horizontal support comprising levels marked since April 25, around 0.6190, could recall the NZD/USD bears targeting the monthly low of 0.6110.
Though, multiple levels marked near the 0.6100 round figure and the yearly low marked in March around 0.6085 could challenge the Kiwi pair sellers afterward.
Trend: Limited upside expected
Technical Levels: Supports and Resistances
NZDUSD currently trading at 0.6216 at the time of writing. Pair opened at 0.6195 and is trading with a change of 0.34% % .
| Overview | Overview.1 | |
|---|---|---|
| 0 | Today last price | 0.6216 |
| 1 | Today Daily Change | 0.0021 |
| 2 | Today Daily Change % | 0.34% |
| 3 | Today daily open | 0.6195 |
The pair is trading below its 20 Daily moving average @ 0.6217, below its 50 Daily moving average @ 0.622 , below its 100 Daily moving average @ 0.6279 and above its 200 Daily moving average @ 0.6161
| Trends | Trends.1 | |
|---|---|---|
| 0 | Daily SMA20 | 0.6217 |
| 1 | Daily SMA50 | 0.6220 |
| 2 | Daily SMA100 | 0.6279 |
| 3 | Daily SMA200 | 0.6161 |
The previous day high was 0.6311 while the previous day low was 0.6182. The daily 38.2% Fib levels comes at 0.6231, expected to provide resistance. Similarly, the daily 61.8% fib level is at 0.6262, expected to provide resistance.
Note the levels of interest below:
- Pivot support is noted at 0.6148, 0.61, 0.6018
- Pivot resistance is noted at 0.6277, 0.6358, 0.6406
| Levels | Levels.1 |
|---|---|
| Previous Daily High | 0.6311 |
| Previous Daily Low | 0.6182 |
| Previous Weekly High | 0.6385 |
| Previous Weekly Low | 0.6182 |
| Previous Monthly High | 0.6389 |
| Previous Monthly Low | 0.6111 |
| Daily Fibonacci 38.2% | 0.6231 |
| Daily Fibonacci 61.8% | 0.6262 |
| Daily Pivot Point S1 | 0.6148 |
| Daily Pivot Point S2 | 0.6100 |
| Daily Pivot Point S3 | 0.6018 |
| Daily Pivot Point R1 | 0.6277 |
| Daily Pivot Point R2 | 0.6358 |
| Daily Pivot Point R3 | 0.6406 |
[/s2If]
Nehcap Expert Advisor
The NEHCAP MT4 EA is high quality professional trading system geared to generate returns without using GRID or martingales. Each trade has strict risk per trade parameter. The pairs under management include EURUSD, GBPUSD, AUDCAD, AUDNZD,GBPAUD, EURAUD, EURCAD, CHFJPY and many more.
The system is trading live: LIVE ACCOUNT TRACKING
You can run it free. Apply for a free trial and track our account. Buy the system or use profit share mechanism to generate returns on your MT4.
Join Our Telegram Group


