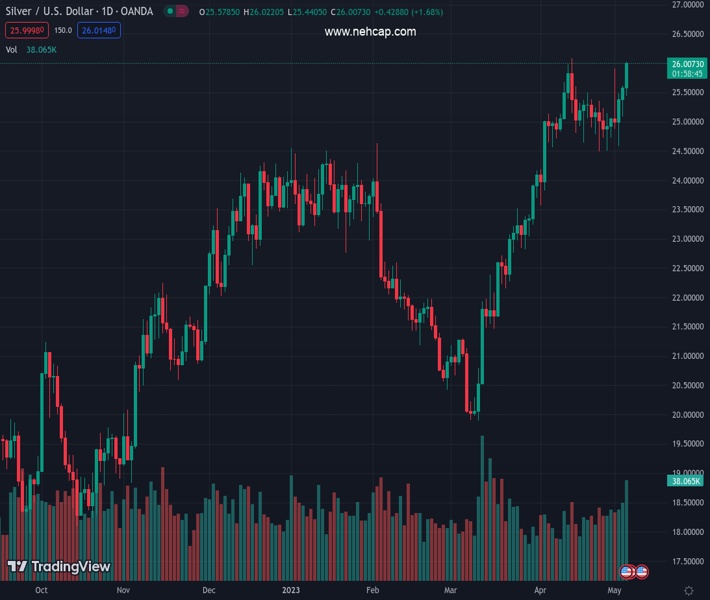
#XAGUSD @ 26.007 Silver price pierces the $26.00 figure but fails to crack the YTD high of $26.08. (Pivot Orderbook analysis)
…
This is a premium post.
[s2If !current_user_can(access_s2member_level4)]Please register for FREE REGISTER to read full post below containing analysis. In case of any error or you think you are not able to read the full post below, please email us at support#nehcap.com [lwa][/s2If] [s2If current_user_can(access_s2member_level1)]
- Silver price pierces the $26.00 figure but fails to crack the YTD high of $26.08.
- A dovish perceived Federal Reserve underpinned the white metal.
- XAG/USD remains in a solid uptrend despite overbought RSI readings; a pullback is possible.
The pair currently trades last at 26.007.
The previous day high was 25.61 while the previous day low was 25.09. The daily 38.2% Fib levels comes at 25.41, expected to provide support. Similarly, the daily 61.8% fib level is at 25.29, expected to provide support.
Silver price rallied but remained shy of cracking the previous year-to-date (YTD) high of $26.08, with XAG remaining supported by buyers keeping the white metal trading nearby the $26.00 figure. Data from the US flashed the labor market is easing amidst the ongoing US banking turmoil, which weighed on market sentiment. The XAG/USD is trading at $25.96 a troy ounce, up 1.40%.
The rise in the precious metals segment was sparked by traders seeking safety, amidst an ongoing deterioration in the United States (US) economy, alongside falling US Treasury bond yields. Reflection of the latter is investors seemed to price in rate cuts by the Federal Reserve in 2023.
On Wednesday, the Fed increased rates to the 5.00% – 5.25% area, 25 bps up from its March meeting level. It signaled that it would be data-dependent while removing “hawkish” language from its monetary policy statement.
Even though the Fed’s decision was perceived as dovish, when Fed Chair Jerome Powell was asked about rate cuts, he said, “Would not be appropriate to cut rates, given our view that inflation will take some time to come down.”
In the meantime, the labor market continued to ease, as shown by Initial Jobless Claims for the week ending on April 29, jumping above the estimated 240K and coming at 242K. Continuing Claims edged down by 38K, to 1.81 million, in the week ending on April 22.
In other data, the US Balance of Trade deficit narrowed in March as Exports increased, as the US Commerce Department reported.
Ahead of the week, the US economic calendar will include the Nonfarm Payrolls for April, which is expected to show 180K jobs added to the economy – less than the previous month’s 236K. The report will also include the Average Hourly Earnings, which are expected to remain at 0.3% MoM, and the Unemployment Rate, which is predicted to be 3.6%.
The XAG/USD remains in a solid uptrend, despite falling to crack $26.08, the YTD high. However, the high readings of the Relative Strength Index (RSI) indicator in the overbought territory could refrain Silver traders from opening new positions, as price action looks overextended. That could pave the way for a mean reversion toward the 20-day EMA, which intersects with the $25.00 figure, as buyers take a respite to lift XAG/USD to higher prices.
Technical Levels: Supports and Resistances
XAGUSD currently trading at 26.01 at the time of writing. Pair opened at 25.58 and is trading with a change of 1.68 % .
| Overview | Overview.1 | |
|---|---|---|
| 0 | Today last price | 26.01 |
| 1 | Today Daily Change | 0.43 |
| 2 | Today Daily Change % | 1.68 |
| 3 | Today daily open | 25.58 |
The pair remains strongly bullish on the daily timeframe. It trades above its 20 SMA @ 25.17, 50 SMA 23.28, 100 SMA @ 23.28 and 200 SMA @ 21.67.
| Trends | Trends.1 | |
|---|---|---|
| 0 | Daily SMA20 | 25.17 |
| 1 | Daily SMA50 | 23.28 |
| 2 | Daily SMA100 | 23.28 |
| 3 | Daily SMA200 | 21.67 |
The previous day high was 25.61 while the previous day low was 25.09. The daily 38.2% Fib levels comes at 25.41, expected to provide support. Similarly, the daily 61.8% fib level is at 25.29, expected to provide support.
Note the levels of interest below:
- Pivot support is noted at 25.24, 24.91, 24.72
- Pivot resistance is noted at 25.76, 25.95, 26.28
| Levels | Levels.1 |
|---|---|
| Previous Daily High | 25.61 |
| Previous Daily Low | 25.09 |
| Previous Weekly High | 25.36 |
| Previous Weekly Low | 24.49 |
| Previous Monthly High | 26.09 |
| Previous Monthly Low | 23.57 |
| Daily Fibonacci 38.2% | 25.41 |
| Daily Fibonacci 61.8% | 25.29 |
| Daily Pivot Point S1 | 25.24 |
| Daily Pivot Point S2 | 24.91 |
| Daily Pivot Point S3 | 24.72 |
| Daily Pivot Point R1 | 25.76 |
| Daily Pivot Point R2 | 25.95 |
| Daily Pivot Point R3 | 26.28 |
[/s2If]
Nehcap Expert Advisor
The NEHCAP MT4 EA is high quality professional trading system geared to generate returns without using GRID or martingales. Each trade has strict risk per trade parameter. The pairs under management include EURUSD, GBPUSD, AUDCAD, AUDNZD,GBPAUD, EURAUD, EURCAD, CHFJPY and many more.
The system is trading live: LIVE ACCOUNT TRACKING
You can run it free. Apply for a free trial and track our account. Buy the system or use profit share mechanism to generate returns on your MT4.
Join Our Telegram Group


