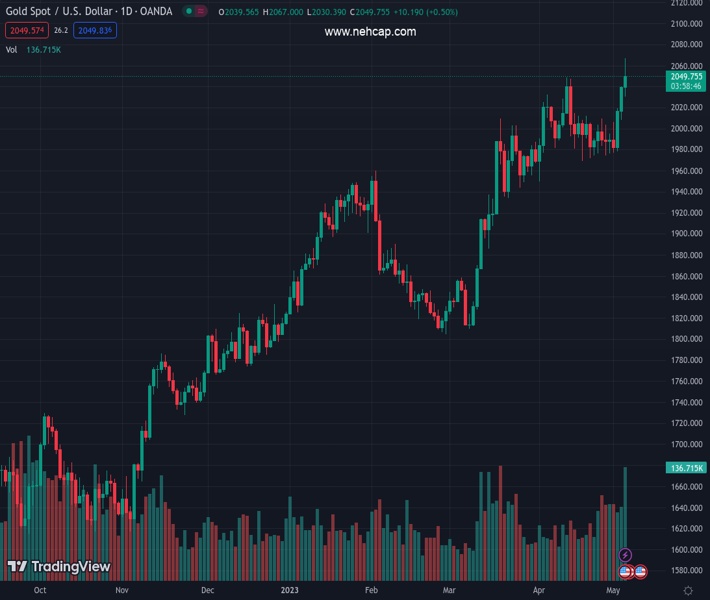
#XAUUSD @ 2,050.69 hits new ATH high as Fed signals pause, though profit-taking weighed on Gold price. (Pivot Orderbook analysis)
…
This is a premium post.
[s2If !current_user_can(access_s2member_level4)]Please register for FREE REGISTER to read full post below containing analysis. In case of any error or you think you are not able to read the full post below, please email us at support#nehcap.com [lwa][/s2If] [s2If current_user_can(access_s2member_level1)]
- XAU/USD hits new ATH high as Fed signals pause, though profit-taking weighed on Gold price.
- The labor market eases as US Initial Jobless Claims rise to 242K, but Continuing Claims fall to 1.81 M.
- XAU/USD Price Analysis: It could dip below $2050 with sellers eyeing $2000; otherwise, buyers could challenge the ATH.
The pair currently trades last at 2050.69.
The previous day high was 2040.47 while the previous day low was 2007.79. The daily 38.2% Fib levels comes at 2027.99, expected to provide support. Similarly, the daily 61.8% fib level is at 2020.27, expected to provide support.
Gold price remains trading in positive territory after hitting a new all-time high (ATH) at around $2081.82. Some profit-taking, risk aversion, and another central bank increasing rates dragged XAU/USD price towards the $2050 area. At the time of writing, XAU/USD exchanges hands at $205.92, holding to gains of 0.40%.
The financial turmoil around the US banking system continues, as PacWest and Western Alliance Bank are under solid selling pressure, which triggered flows towards safety. Therefore, XAU/USD continues to hold its ground, despite recent US Dollar (USD) strength.
The economic agenda in the United States (US) revealed that unemployment claims for the week ending on April 29 jumped to 242K, exceeding estimates of 240K, a report cheered by US Federal Reserve (Fed) officials. Continuing claims, which include citizens receiving unemployment benefits for a week or more, fell by 38K, to 1.81 million, in the week ending on April 22.
The XAU/USD reached its new ATH high after the Fed increased rates above the 5% threshold and signaled that it would be data-dependent, opening the door for a pause. However, Fed Chair Jerome Powell reiterated that inflation remains high and that the labor market is tight. He kept the chances for additional tightening on the table and pushed back against cutting rates amidst inflation levels, twice the Fed’s goal.
On Thursday, the US Dollar Index (DXY), which measures the value of six currencies against the buck, fluctuates between gains and losses at 101.340, influenced by US Treasury bond yields. The US 10-year Treasury bond yield is losing eight bps, down to 3.315%, a tailwind for XAU/USD’s price.
On Friday, the US economic docket will feature the US Nonfarm Payrolls report for April, expected at 180K, less than the prior’s month 236K jobs added to the economy. Additionally, Average Hourly Earnings are expected to remain unchanged at 0.3% MoM, while the Unemployment Rate is foreseen at 3.6%.
From a daily chart perspective, the XAU/USD is still upward biased, though Thursday’s price action opens the door for a mean reversion move. If XAU/USD’s Thursday daily candle closes beneath $2050, that will exacerbate a correction. Initially, XAU/USD could fall towards $2030.50, May 4 low, followed by the March 20 swing high, which turned support at $2009.75. A breach of the latter will expose the $2000 figure.
Conversely, a bullish continuation could happen if XAU/USD buyers hold prices above $2050 as they eye the $2100 barrier.
Technical Levels: Supports and Resistances
XAUUSD currently trading at 2051.37 at the time of writing. Pair opened at 2038.92 and is trading with a change of 0.61 % .
| Overview | Overview.1 | |
|---|---|---|
| 0 | Today last price | 2051.37 |
| 1 | Today Daily Change | 12.45 |
| 2 | Today Daily Change % | 0.61 |
| 3 | Today daily open | 2038.92 |
The pair remains strongly bullish on the daily timeframe. It trades above its 20 SMA @ 2002.88, 50 SMA 1944.39, 100 SMA @ 1904.04 and 200 SMA @ 1811.78.
| Trends | Trends.1 | |
|---|---|---|
| 0 | Daily SMA20 | 2002.88 |
| 1 | Daily SMA50 | 1944.39 |
| 2 | Daily SMA100 | 1904.04 |
| 3 | Daily SMA200 | 1811.78 |
The previous day high was 2040.47 while the previous day low was 2007.79. The daily 38.2% Fib levels comes at 2027.99, expected to provide support. Similarly, the daily 61.8% fib level is at 2020.27, expected to provide support.
Note the levels of interest below:
- Pivot support is noted at 2017.65, 1996.38, 1984.97
- Pivot resistance is noted at 2050.33, 2061.74, 2083.01
| Levels | Levels.1 |
|---|---|
| Previous Daily High | 2040.47 |
| Previous Daily Low | 2007.79 |
| Previous Weekly High | 2009.41 |
| Previous Weekly Low | 1974.13 |
| Previous Monthly High | 2048.75 |
| Previous Monthly Low | 1949.83 |
| Daily Fibonacci 38.2% | 2027.99 |
| Daily Fibonacci 61.8% | 2020.27 |
| Daily Pivot Point S1 | 2017.65 |
| Daily Pivot Point S2 | 1996.38 |
| Daily Pivot Point S3 | 1984.97 |
| Daily Pivot Point R1 | 2050.33 |
| Daily Pivot Point R2 | 2061.74 |
| Daily Pivot Point R3 | 2083.01 |
[/s2If]
Nehcap Expert Advisor
The NEHCAP MT4 EA is high quality professional trading system geared to generate returns without using GRID or martingales. Each trade has strict risk per trade parameter. The pairs under management include EURUSD, GBPUSD, AUDCAD, AUDNZD,GBPAUD, EURAUD, EURCAD, CHFJPY and many more.
The system is trading live: LIVE ACCOUNT TRACKING
You can run it free. Apply for a free trial and track our account. Buy the system or use profit share mechanism to generate returns on your MT4.
Join Our Telegram Group


