#USDINR @ 81.7870 buyers prod eight-day-old descending resistance line while defending Friday’s corrective bounce., @nehcap view: Limited upside expected (Pivot Orderbook analysis)
…
This is a premium post.
[s2If !current_user_can(access_s2member_level4)]Please register for FREE REGISTER to read full post below containing analysis. In case of any error or you think you are not able to read the full post below, please email us at support#nehcap.com [lwa][/s2If] [s2If current_user_can(access_s2member_level1)]
- USD/INR buyers prod eight-day-old descending resistance line while defending Friday’s corrective bounce.
- Gradually improving RSI conditions back late rebound but key SMAs challenge Indian Rupee sellers.
- Two-month-old support area appears a tough nut to crack for USD/INR bears.
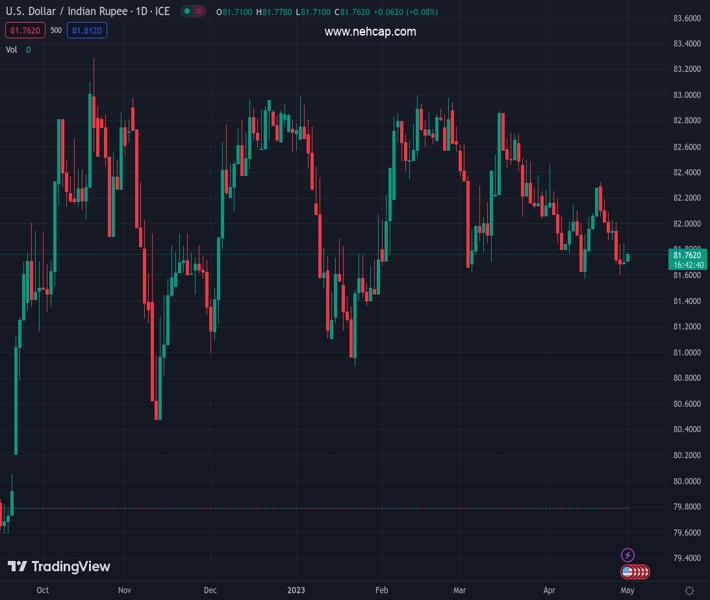
The pair currently trades last at 81.7870.
The previous day high was 81.8705 while the previous day low was 81.7044. The daily 38.2% Fib levels comes at 81.7679, expected to provide support. Similarly, the daily 61.8% fib level is at 81.8071, expected to provide resistance.
USD/INR snaps three-day downtrend during a holiday-driven illiquid trading session on early Monday. In doing so, the Indian Rupee (INR) pair jostles with a one-week-old downward-sloping trend line resistance following a sustained bounce off a seven-week-old horizontal support zone.
Given the sluggish MACD signals and a gradually improving RSI (14) line, the USD/INR price is likely to mark another attempt in crossing the aforementioned trend line resistance, around 81.80 by the press time.
However, the 100-SMA and the 200-SMA, respectively near 81.95 and 82.10, could challenge the USD/INR bulls afterward.
Even so, a five-week-old falling resistance line, near 82.40 by the press time, could challenge the Indian Rupee sellers before giving them control.
Meanwhile, USD/INR pullback may find multiple supports near 81.65, a break of which will highlight a seven-week-old horizontal support zone near 81.50 for the pair sellers to watch.
In a case where the Indian Rupee buyers dominate past 81.50, the odds of witnessing the pair’s slump towards the 81.00 round figure and then to the Year-To-Date (YTD) low surrounding 80.90 can’t be ruled out.
Overall, USD/INR consolidates recent losses amid holidays in India.
Trend: Limited upside expected
Technical Levels: Supports and Resistances
USDINR currently trading at 81.7875 at the time of writing. Pair opened at 81.7254 and is trading with a change of 0.08% % .
| Overview | Overview.1 | |
|---|---|---|
| 0 | Today last price | 81.7875 |
| 1 | Today Daily Change | 0.0621 |
| 2 | Today Daily Change % | 0.08% |
| 3 | Today daily open | 81.7254 |
The pair is trading below its 20 Daily moving average @ 81.9556, below its 50 Daily moving average @ 82.2116 , below its 100 Daily moving average @ 82.2326 and above its 200 Daily moving average @ 81.5734
| Trends | Trends.1 | |
|---|---|---|
| 0 | Daily SMA20 | 81.9556 |
| 1 | Daily SMA50 | 82.2116 |
| 2 | Daily SMA100 | 82.2326 |
| 3 | Daily SMA200 | 81.5734 |
The previous day high was 81.8705 while the previous day low was 81.7044. The daily 38.2% Fib levels comes at 81.7679, expected to provide support. Similarly, the daily 61.8% fib level is at 81.8071, expected to provide resistance.
Note the levels of interest below:
- Pivot support is noted at 81.6631, 81.6007, 81.497
- Pivot resistance is noted at 81.8291, 81.9328, 81.9952
| Levels | Levels.1 |
|---|---|
| Previous Daily High | 81.8705 |
| Previous Daily Low | 81.7044 |
| Previous Weekly High | 82.1614 |
| Previous Weekly Low | 81.4850 |
| Previous Monthly High | 82.5092 |
| Previous Monthly Low | 81.4850 |
| Daily Fibonacci 38.2% | 81.7679 |
| Daily Fibonacci 61.8% | 81.8071 |
| Daily Pivot Point S1 | 81.6631 |
| Daily Pivot Point S2 | 81.6007 |
| Daily Pivot Point S3 | 81.4970 |
| Daily Pivot Point R1 | 81.8291 |
| Daily Pivot Point R2 | 81.9328 |
| Daily Pivot Point R3 | 81.9952 |
[/s2If]
Nehcap Expert Advisor
The NEHCAP MT4 EA is high quality professional trading system geared to generate returns without using GRID or martingales. Each trade has strict risk per trade parameter. The pairs under management include EURUSD, GBPUSD, AUDCAD, AUDNZD,GBPAUD, EURAUD, EURCAD, CHFJPY and many more.
The system is trading live: LIVE ACCOUNT TRACKING
You can run it free. Apply for a free trial and track our account. Buy the system or use profit share mechanism to generate returns on your MT4.
Join Our Telegram Group


