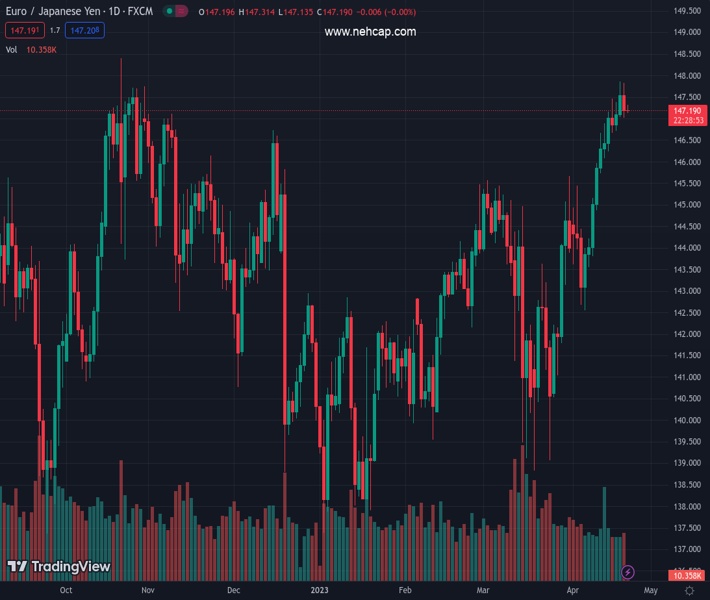
#EURJPY @ 147.210 Dark cloud cover in the daily chart suggests a pullback could be underway. (Pivot Orderbook analysis)
…
This is a premium post.
[s2If !current_user_can(access_s2member_level4)]Please register for PREMIUM VERSION HERE to read full post below containing analysis. In case of any error or you think you are not able to read the full post below, please email us at support#nehcap.com [lwa][/s2If] [s2If current_user_can(access_s2member_level4)]
- Dark cloud cover in the EUR/JPY daily chart suggests a pullback could be underway.
- EUR/JPY sellers are losing momentum as oscillators shifted neutral.
The pair currently trades last at 147.210.
The previous day high was 147.86 while the previous day low was 147.04. The daily 38.2% Fib levels comes at 147.55, expected to provide resistance. Similarly, the daily 61.8% fib level is at 147.36, expected to provide resistance.
The EUR/JPY retraced Wednesday’s gains on Thursday, as the pair formed a dark cloud cover. The two-candlestick chart pattern suggests the pair could be headed downwards, but a daily close below 147.02 is needed to confirm the chart pattern. As Friday’s Asian session begins, the EUR/JPY is trading at 147.25, registering minuscule gains of 0.04%.
EUR/JPY has managed to extend its rally past the 147.00 area, reaching a YTD high at 147.86; it retreated to the 147.20 area as oscillators turned flat, suggesting buyers are losing momentum. In addition, a forming dark cloud cover could open the door to test 147.00, a crucial area for buyers/sellers, which, once cleared, the latter will eye the 20-day Exponential Moving Average (EMA) at 145.52 as the first support to test.
If the EUR/JPY resumes downwards after challenging 145.52, the following support should be the psychological 145.00 figure, followed by the 50-day Exponential Moving Average (EMA) at 144.15.
On the other hand, if EUR/JPY stays above 147.00, that could pave the way for further upside. The EUR/JPY key resistance areas lie at the YTD high of 147.86, followed by the 148.00 mark. Break above; the EUR/JPY will challenge the 2022 high at 148.40.
Technical Levels: Supports and Resistances
EURJPY currently trading at 147.21 at the time of writing. Pair opened at 147.59 and is trading with a change of -0.26 % .
| Overview | Overview.1 | |
|---|---|---|
| 0 | Today last price | 147.21 |
| 1 | Today Daily Change | -0.38 |
| 2 | Today Daily Change % | -0.26 |
| 3 | Today daily open | 147.59 |
The pair remains strongly bullish on the daily timeframe. It trades above its 20 SMA @ 144.55, 50 SMA 143.72, 100 SMA @ 142.67 and 200 SMA @ 142.2.
| Trends | Trends.1 | |
|---|---|---|
| 0 | Daily SMA20 | 144.55 |
| 1 | Daily SMA50 | 143.72 |
| 2 | Daily SMA100 | 142.67 |
| 3 | Daily SMA200 | 142.20 |
The previous day high was 147.86 while the previous day low was 147.04. The daily 38.2% Fib levels comes at 147.55, expected to provide resistance. Similarly, the daily 61.8% fib level is at 147.36, expected to provide resistance.
Note the levels of interest below:
- Pivot support is noted at 147.14, 146.68, 146.32
- Pivot resistance is noted at 147.95, 148.32, 148.77
| Levels | Levels.1 |
|---|---|
| Previous Daily High | 147.86 |
| Previous Daily Low | 147.04 |
| Previous Weekly High | 147.16 |
| Previous Weekly Low | 143.80 |
| Previous Monthly High | 145.67 |
| Previous Monthly Low | 138.83 |
| Daily Fibonacci 38.2% | 147.55 |
| Daily Fibonacci 61.8% | 147.36 |
| Daily Pivot Point S1 | 147.14 |
| Daily Pivot Point S2 | 146.68 |
| Daily Pivot Point S3 | 146.32 |
| Daily Pivot Point R1 | 147.95 |
| Daily Pivot Point R2 | 148.32 |
| Daily Pivot Point R3 | 148.77 |
[/s2If]
Join Our Telegram Group


