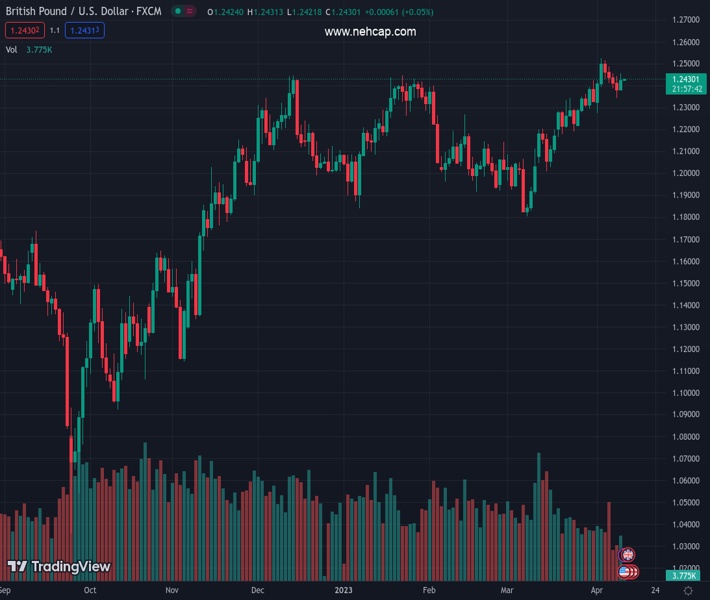
#GBPUSD @ 1.24299 is making efforts for a breakout of the Falling Channel pattern. (Pivot Orderbook analysis)
…
This is a premium post.
[s2If !current_user_can(access_s2member_level4)]Please register for PREMIUM VERSION HERE to read full post below containing analysis. In case of any error or you think you are not able to read the full post below, please email us at support#nehcap.com [lwa][/s2If] [s2If current_user_can(access_s2member_level4)]
- GBP/USD is making efforts for a breakout of the Falling Channel pattern.
- An absence of anxiety among investors ahead of US CPI conveys that they have digested expectations of the Fed’s rate hikes.
- Wednesday’s inflation data carries higher value as it will be the last inflation data before Fed’s May meeting.
The pair currently trades last at 1.24299.
The previous day high was 1.2443 while the previous day low was 1.2344. The daily 38.2% Fib levels comes at 1.2382, expected to provide support. Similarly, the daily 61.8% fib level is at 1.2405, expected to provide support.
The GBP/USD pair has rebounded to near 1.2430 in the early Asian session after defending the round-level support of 1.2400. The Cable is gathering strength for extending its rally amid an upbeat market mood ahead of the release of the United States inflation. An absence of anxiety among investors ahead of the US Consumer Price Index (CPI) indicates that investors have digested expectations of consecutive 25 basis points (bps) rate hike from the Federal Reserve (Fed).
Despite knowing the fact that Wednesday’s inflation data carries higher value as it will be the last inflation data before May’s monetary policy meeting, investors are hammering the US Dollar Index. The USD Index has turned sideways after a corrective move from 102.30 and is expected to test the critical support of 102.00.
Apart from the US inflation data, the speech from Bank of England (BoE) Governor Andrew Bailey will be keenly watched. BoE Bailey is expected to provide guidance about the likely monetary policy action ahead. A hawkish guidance is expected from BoE Bailey amid an absence of evidence of United Kingdom inflation softening.
GBP/USD is gathering strength to deliver a breakout of the Falling Channel formed on an hourly scale. The Cable is hovering near the edge of the upper portion of the aforementioned chart pattern. The asset looks confident above the 20-period Exponential Moving Average (EMA) at 1.2420 as it indicates that the short-term trend is bullish.
Meanwhile, the Relative Strength Index (RSI) (14) is eyeing a decisive break above 60.00 for activation of the bullish momentum.
For an upside move, the Cable needs to surpass April 11 high at 1.2457, which will trigger short coverings and will drive the major toward the psychological resistance of 1.2500 followed by April 04 high at 1.2525.
On the flip side, a break below the round-level support of 1.2400 will expose the asset to April 10 low at 1.2344 and March 30 low at 1.2294.
Technical Levels: Supports and Resistances
GBPUSD currently trading at 1.2428 at the time of writing. Pair opened at 1.2382 and is trading with a change of 0.37 % .
| Overview | Overview.1 | |
|---|---|---|
| 0 | Today last price | 1.2428 |
| 1 | Today Daily Change | 0.0046 |
| 2 | Today Daily Change % | 0.3700 |
| 3 | Today daily open | 1.2382 |
The pair remains strongly bullish on the daily timeframe. It trades above its 20 SMA @ 1.2303, 50 SMA 1.2156, 100 SMA @ 1.2165 and 200 SMA @ 1.1903.
| Trends | Trends.1 | |
|---|---|---|
| 0 | Daily SMA20 | 1.2303 |
| 1 | Daily SMA50 | 1.2156 |
| 2 | Daily SMA100 | 1.2165 |
| 3 | Daily SMA200 | 1.1903 |
The previous day high was 1.2443 while the previous day low was 1.2344. The daily 38.2% Fib levels comes at 1.2382, expected to provide support. Similarly, the daily 61.8% fib level is at 1.2405, expected to provide support.
Note the levels of interest below:
- Pivot support is noted at 1.2337, 1.2291, 1.2238
- Pivot resistance is noted at 1.2435, 1.2488, 1.2533
| Levels | Levels.1 |
|---|---|
| Previous Daily High | 1.2443 |
| Previous Daily Low | 1.2344 |
| Previous Weekly High | 1.2525 |
| Previous Weekly Low | 1.2275 |
| Previous Monthly High | 1.2424 |
| Previous Monthly Low | 1.1803 |
| Daily Fibonacci 38.2% | 1.2382 |
| Daily Fibonacci 61.8% | 1.2405 |
| Daily Pivot Point S1 | 1.2337 |
| Daily Pivot Point S2 | 1.2291 |
| Daily Pivot Point S3 | 1.2238 |
| Daily Pivot Point R1 | 1.2435 |
| Daily Pivot Point R2 | 1.2488 |
| Daily Pivot Point R3 | 1.2533 |
[/s2If]
Join Our Telegram Group


