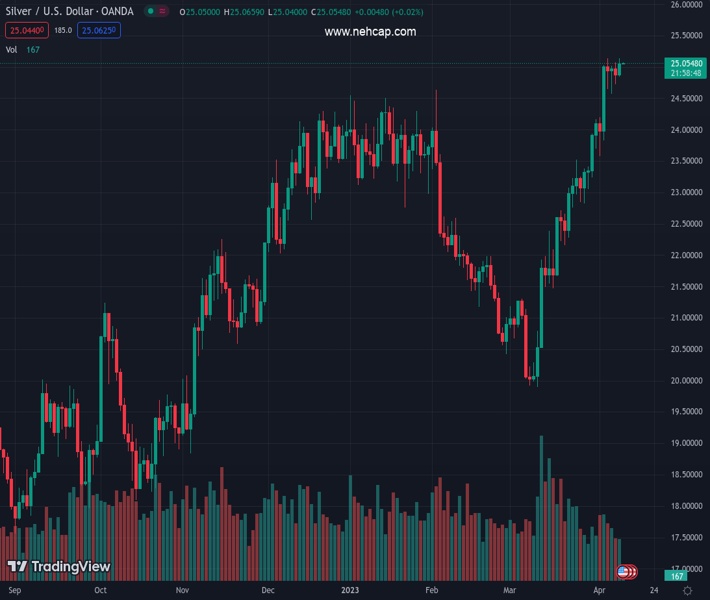
#XAGUSD @ 25.052 Silver price remains sidelined after rising the most in a week, prods bearish chart formation on hourly play., @nehcap view: Further upside expected (Pivot Orderbook analysis)
…
This is a premium post.
[s2If !current_user_can(access_s2member_level4)]Please register for PREMIUM VERSION HERE to read full post below containing analysis. In case of any error or you think you are not able to read the full post below, please email us at support#nehcap.com [lwa][/s2If] [s2If current_user_can(access_s2member_level4)]
- Silver price remains sidelined after rising the most in a week, prods bearish chart formation on hourly play.
- Sustained trading beyond key HMAs, upbeat RSI favor XAG/USD buyers.
- Fortnight-old ascending support line acts as an extra filter towards the south.
- Silver buyer can aim for April 2022 peak on clear break of $25.15.
The pair currently trades last at 25.052.
The previous day high was 25.08 while the previous day low was 24.72. The daily 38.2% Fib levels comes at 24.86, expected to provide support. Similarly, the daily 61.8% fib level is at 24.94, expected to provide support.
Silver price (XAG/USD) seesaws around $25.00 after posting the biggest daily gains in a week the previous day. In doing so, the bright metal braces to reject the “Double top” bearish chart formation on the hourly play.
It’s worth noting that the quote’s sustained trading above the 100 and 200 Hourly Moving Averages (HMAs) join firmer RSI (14), not overbought, to keep the Silver buyers hopeful of breaking the double tops near $25.15 and reject the bearish chart pattern.
Following that, a run-up toward April 2022 high near $26.25 can’t be ruled out. However, the RSI may turn overbought afterward and can prod the Silver buyers before they approach the previous yearly top surrounding $27.00.
Meanwhile, the 100-HMA and a two-week-old ascending trend line, respectively near $24.90 and $24.70, restrict the short-term downside of the XAG/USD price.
Should the quote breaks the $24.70, the previous Thursday’s low of $24.60 and the 200-HMA level of near $24.35 will be crucial as a break of which can direct Silver price toward the sub-$24.00 zone.
Overall, the Silver price is likely to remain firmer but the quote’s further upside hinges on a clear break of $25.15.
Trend: Further upside expected
Technical Levels: Supports and Resistances
XAGUSD currently trading at 25.06 at the time of writing. Pair opened at 24.86 and is trading with a change of 0.80% % .
| Overview | Overview.1 | |
|---|---|---|
| 0 | Today last price | 25.06 |
| 1 | Today Daily Change | 0.20 |
| 2 | Today Daily Change % | 0.80% |
| 3 | Today daily open | 24.86 |
The pair remains strongly bullish on the daily timeframe. It trades above its 20 SMA @ 23.27, 50 SMA 22.31, 100 SMA @ 22.76 and 200 SMA @ 21.14.
| Trends | Trends.1 | |
|---|---|---|
| 0 | Daily SMA20 | 23.27 |
| 1 | Daily SMA50 | 22.31 |
| 2 | Daily SMA100 | 22.76 |
| 3 | Daily SMA200 | 21.14 |
The previous day high was 25.08 while the previous day low was 24.72. The daily 38.2% Fib levels comes at 24.86, expected to provide support. Similarly, the daily 61.8% fib level is at 24.94, expected to provide support.
Note the levels of interest below:
- Pivot support is noted at 24.7, 24.53, 24.34
- Pivot resistance is noted at 25.05, 25.24, 25.41
| Levels | Levels.1 |
|---|---|
| Previous Daily High | 25.08 |
| Previous Daily Low | 24.72 |
| Previous Weekly High | 25.14 |
| Previous Weekly Low | 23.57 |
| Previous Monthly High | 24.16 |
| Previous Monthly Low | 19.90 |
| Daily Fibonacci 38.2% | 24.86 |
| Daily Fibonacci 61.8% | 24.94 |
| Daily Pivot Point S1 | 24.70 |
| Daily Pivot Point S2 | 24.53 |
| Daily Pivot Point S3 | 24.34 |
| Daily Pivot Point R1 | 25.05 |
| Daily Pivot Point R2 | 25.24 |
| Daily Pivot Point R3 | 25.41 |
[/s2If]
Join Our Telegram Group


