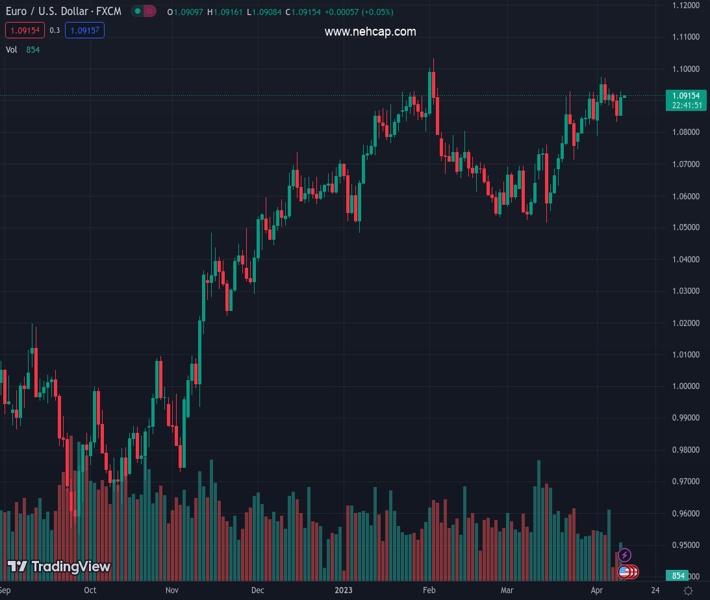
#EURUSD @ 1.09155 has demonstrated a recovery move from 1.0900 as investors seem not worried about the US inflation release. (Pivot Orderbook analysis)
…
This is a premium post.
[s2If !current_user_can(access_s2member_level4)]Please register for PREMIUM VERSION HERE to read full post below containing analysis. In case of any error or you think you are not able to read the full post below, please email us at support#nehcap.com [lwa][/s2If] [s2If current_user_can(access_s2member_level4)]
- EUR/USD has demonstrated a recovery move from 1.0900 as investors seem not worried about the US inflation release.
- S&P500 remained choppy on Tuesday as technology stocks dragged on expectations of weaker revenue guidance.
- The European Central Bank will keep on hiking rates despite evidence of a decline in retail demand.
The pair currently trades last at 1.09155.
The previous day high was 1.0917 while the previous day low was 1.0837. The daily 38.2% Fib levels comes at 1.0868, expected to provide support. Similarly, the daily 61.8% fib level is at 1.0887, expected to provide support.
The EUR/USD pair has shown a recovery move after a minor correction to near the round-level support of 1.0900 in the early Asian session. The major currency pair is looking to extend its recovery above the immediate resistance of 1.0928 as investors don’t seem anxious ahead of the release of the United States Inflation data.
S&P500 remained choppy on Tuesday as technology stocks dragged on expectations of weaker revenue guidance. Investors are hoping for weak guidance from tech-savvy stocks amid higher rates from the Federal Reserve (Fed). Also, recent banking turmoil could impact the quarterly result of the banking sector, portraying a cautious market mood.
The US Dollar Index (DXY) has dropped to near 102.15 after failing to extend its recovery above 102.30. The USD Index is likely to extend its downside below the 102.00 support as investors have digested expectations of more rate hikes from the Federal Reserve (Fed).
Meanwhile, the commentary from Chicago Fed President Austan Goolsbee has also weighed on the US Dollar. Fed policymakers have advised a cautious approach as the combination of tight credit conditions and further restrictive monetary policy can hit sectors and regions differently than if monetary policy was acting on its own.
For further guidance on the US Dollar, US Consumer Price Index (CPI) will be keenly watched. Analysts at Danske Bank expect “While lower energy prices will ease March headline inflation to around +0.2% MoM, we expect core inflation to remain elevated at +0.4%.”
On the Eurozone front, monthly Retail Sales contracted by 0.8% as expected by investors. And, annual Retail Sales contracted by 3.0% while the street was anticipating more contraction to 3.5%. However, the European Central Bank (ECB) will keep on hiking rates despite evidence of a decline in retail demand.
ECB Governing Council member Francois Villeroy de Galhau warned that “Inflation is becoming more prevalent and potentially more persistent.” He further added, “The impact of rate hikes will be amplified in the coming months.”
Technical Levels: Supports and Resistances
EURUSD currently trading at 1.0912 at the time of writing. Pair opened at 1.0861 and is trading with a change of 0.47 % .
| Overview | Overview.1 | |
|---|---|---|
| 0 | Today last price | 1.0912 |
| 1 | Today Daily Change | 0.0051 |
| 2 | Today Daily Change % | 0.4700 |
| 3 | Today daily open | 1.0861 |
The pair remains strongly bullish on the daily timeframe. It trades above its 20 SMA @ 1.081, 50 SMA 1.0735, 100 SMA @ 1.0685 and 200 SMA @ 1.0355.
| Trends | Trends.1 | |
|---|---|---|
| 0 | Daily SMA20 | 1.0810 |
| 1 | Daily SMA50 | 1.0735 |
| 2 | Daily SMA100 | 1.0685 |
| 3 | Daily SMA200 | 1.0355 |
The previous day high was 1.0917 while the previous day low was 1.0837. The daily 38.2% Fib levels comes at 1.0868, expected to provide support. Similarly, the daily 61.8% fib level is at 1.0887, expected to provide support.
Note the levels of interest below:
- Pivot support is noted at 1.0827, 1.0792, 1.0747
- Pivot resistance is noted at 1.0907, 1.0952, 1.0987
| Levels | Levels.1 |
|---|---|
| Previous Daily High | 1.0917 |
| Previous Daily Low | 1.0837 |
| Previous Weekly High | 1.0973 |
| Previous Weekly Low | 1.0788 |
| Previous Monthly High | 1.0930 |
| Previous Monthly Low | 1.0516 |
| Daily Fibonacci 38.2% | 1.0868 |
| Daily Fibonacci 61.8% | 1.0887 |
| Daily Pivot Point S1 | 1.0827 |
| Daily Pivot Point S2 | 1.0792 |
| Daily Pivot Point S3 | 1.0747 |
| Daily Pivot Point R1 | 1.0907 |
| Daily Pivot Point R2 | 1.0952 |
| Daily Pivot Point R3 | 1.0987 |
[/s2If]
Join Our Telegram Group


