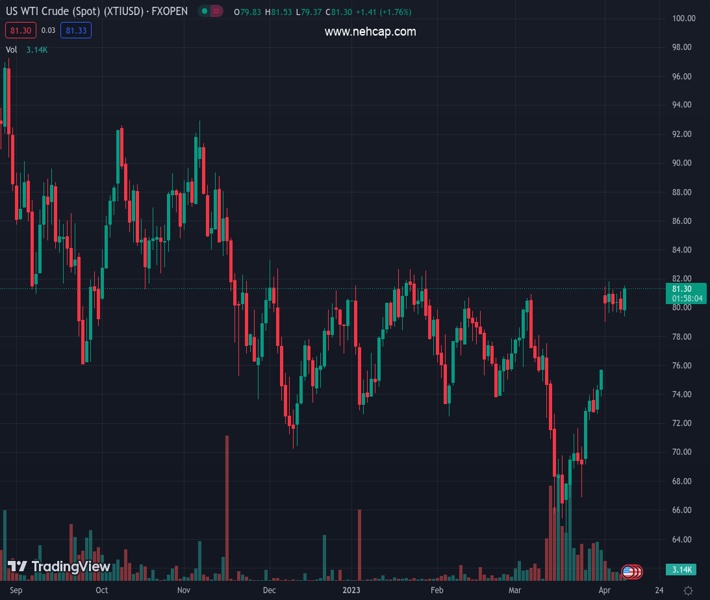
WTI jumps to test resistance again as US Dollar retreats. (Pivot Orderbook analysis)
…
This is a premium post.
[s2If !current_user_can(access_s2member_level4)]Please register for PREMIUM VERSION HERE to read full post below containing analysis. In case of any error or you think you are not able to read the full post below, please email us at support#nehcap.com [lwa][/s2If] [s2If current_user_can(access_s2member_level4)]
- WTI jumps to test resistance again as US Dollar retreats.
- Production cuts keeps the black gold better bid.
The pair currently trades last at 81.44.
The previous day high was 81.19 while the previous day low was 79.64. The daily 38.2% Fib levels comes at 80.23, expected to provide support. Similarly, the daily 61.8% fib level is at 80.6, expected to provide support.
WTI oil prices climbed over 2% to $81.55 a barrel on Tuesday while investors get set for data that may show further declines in US oil and fuel inventories. Additionally, a weaker US Dollar ahead of potentially cooling inflation data on Wednesday has been bullish for energy prices.
The US reports its Consumer Price Index on Wednesday and analysts at TD Securities argued that ´´core prices likely cooled off modestly in March, with the index still rising a strong 0.4% MoM.´´ Ebbing price pressures are diminishing the prospects of further Federal Reserve interest rate hikes. Markets are pricing for the Fed to cut rates by year-end on an expected recession and a softer US Dollar, as a consequence, makes oil cheaper for non-Dollar denominated investments, helping to support higher oil. Also, tightness in global oil supplies is supporting crude prices with the continued halt of 400,000 bpd of Iraqi crude oil exports.
Looking to core fundamentals, a Wall Street Journal survey is forecasting that tomorrow’s weekly Energy Information Administration report will show a 600,000-barrel decline in crude-oil stockpiles and a 1.7M-barrel fall in gasoline inventories. This would mark an eighth consecutive decline in gasoline inventories and will put crude inventories at their lowest since early February.
Meanwhile, The Energy Information Administration on Tuesday raised its price forecast for Brent crude oil by 2.5% in the agency’s influential monthly Short-Term Energy Outlook following OPEC’s decision earlier this month to reduce production by around 1.1 million barrels per day to support prices and lower global oil inventories. The agency raised its forecast for Brent crude, the global benchmark, to US$85.00 per barrel from its prior US$83.00 target on lower supply.
On the flip side, a bearish factor for crude was the International Monetary Fund, IMF, said that five years from now, global growth is expected to be around 3% — the lowest medium-term forecast in a World Economic Outlook for over 30 years.
Technical Levels: Supports and Resistances
XTIUSD currently trading at 81.44 at the time of writing. Pair opened at 79.93 and is trading with a change of 1.89 % .
| Overview | Overview.1 | |
|---|---|---|
| 0 | Today last price | 81.44 |
| 1 | Today Daily Change | 1.51 |
| 2 | Today Daily Change % | 1.89 |
| 3 | Today daily open | 79.93 |
The pair is trading above its 20 Daily moving average @ 73.38, above its 50 Daily moving average @ 75.75 , above its 100 Daily moving average @ 76.79 and below its 200 Daily moving average @ 82.96
| Trends | Trends.1 | |
|---|---|---|
| 0 | Daily SMA20 | 73.38 |
| 1 | Daily SMA50 | 75.75 |
| 2 | Daily SMA100 | 76.79 |
| 3 | Daily SMA200 | 82.96 |
The previous day high was 81.19 while the previous day low was 79.64. The daily 38.2% Fib levels comes at 80.23, expected to provide support. Similarly, the daily 61.8% fib level is at 80.6, expected to provide support.
Note the levels of interest below:
- Pivot support is noted at 79.32, 78.71, 77.77
- Pivot resistance is noted at 80.86, 81.8, 82.41
| Levels | Levels.1 |
|---|---|
| Previous Daily High | 81.19 |
| Previous Daily Low | 79.64 |
| Previous Weekly High | 81.81 |
| Previous Weekly Low | 75.76 |
| Previous Monthly High | 80.99 |
| Previous Monthly Low | 64.39 |
| Daily Fibonacci 38.2% | 80.23 |
| Daily Fibonacci 61.8% | 80.60 |
| Daily Pivot Point S1 | 79.32 |
| Daily Pivot Point S2 | 78.71 |
| Daily Pivot Point S3 | 77.77 |
| Daily Pivot Point R1 | 80.86 |
| Daily Pivot Point R2 | 81.80 |
| Daily Pivot Point R3 | 82.41 |
[/s2If]
Join Our Telegram Group


