#AUDUSD @ 0.66612 attracts some buying on Tuesday and snaps a five-day losing streak to a multi-week low. (Pivot Orderbook analysis)
…
This is a premium post.
[s2If !current_user_can(access_s2member_level4)]Please register for PREMIUM VERSION HERE to read full post below containing analysis. In case of any error or you think you are not able to read the full post below, please email us at support#nehcap.com [lwa][/s2If] [s2If current_user_can(access_s2member_level4)]
- AUD/USD attracts some buying on Tuesday and snaps a five-day losing streak to a multi-week low.
- A generally positive risk tone undermines the safe-haven USD and benefits the risk-sensitive Aussie.
- Rising US bond yields limit the USD losses and keep a lid on any meaningful upside for the major.
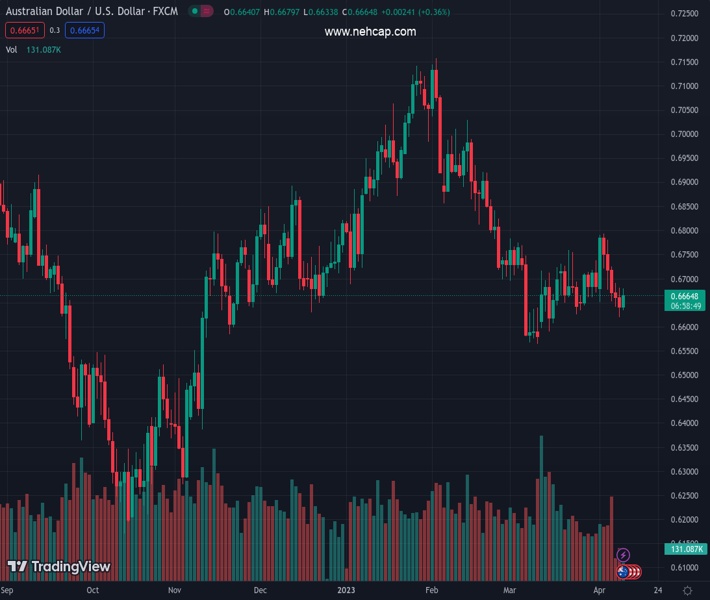
The pair currently trades last at 0.66612.
The previous day high was 0.668 while the previous day low was 0.662. The daily 38.2% Fib levels comes at 0.6643, expected to provide support. Similarly, the daily 61.8% fib level is at 0.6657, expected to provide support.
The AUD/USD pair sticks to its intraday gains through the early part of the North American session and is currently placed around the 0.6660-0.6655 region, up nearly 0.25% for the day.
The US Dollar (USD) meets with some supply and stalls a four-day-old recovery trend from over a two-month low touched last week, which, in turn, is seen pushing the AUD/USD pair higher. A generally positive tone around the equity markets is seen as a key factor undermining the Greenback’s relative safe-haven status and lending some support to the risk-sensitive Aussie.
The upside for the AUD/USD pair, however, remains capped amid signs that the post-COVID economic recovery in China was losing steam. The concerns were fueled by softer Chinese data, which showed that consumer inflation hit an 18-month low and producer price inflation contracted at a steady pace. This, in turn, acts as a headwind for the China-proxy Australian Dollar.
Apart from this, speculations that the Federal Reserve (Fed) may continue raising interest rates, for now, seem to have put a floor under the US Treasury bond yields. In fact, the current market pricing indicates a greater chance of another 25 bps lift-off at the next FOMC meeting in May. This lends some support to the USD and contributes to capping the AUD/USD pair, at least for now.
Traders also seem reluctant to place aggressive bets ahead of the release of the latest US consumer inflation figures and the FOMC meeting minutes on Wednesday. Investors this week will also confront the release of monthly jobs data from Australia on Thursday, followed by the US monthly Retail Sales on Friday, which should provide a fresh impetus to the AUD/USD pair.
Technical Levels: Supports and Resistances
AUDUSD currently trading at 0.6656 at the time of writing. Pair opened at 0.6641 and is trading with a change of 0.23 % .
| Overview | Overview.1 | |
|---|---|---|
| 0 | Today last price | 0.6656 |
| 1 | Today Daily Change | 0.0015 |
| 2 | Today Daily Change % | 0.2300 |
| 3 | Today daily open | 0.6641 |
The pair remains strongly bearish on the daily time frame. It trades below the 20 SMA @ 0.6687, 50 SMA 0.6775, 100 SMA @ 0.68 and 200 SMA @ 0.6746.
| Trends | Trends.1 | |
|---|---|---|
| 0 | Daily SMA20 | 0.6687 |
| 1 | Daily SMA50 | 0.6775 |
| 2 | Daily SMA100 | 0.6800 |
| 3 | Daily SMA200 | 0.6746 |
The previous day high was 0.668 while the previous day low was 0.662. The daily 38.2% Fib levels comes at 0.6643, expected to provide support. Similarly, the daily 61.8% fib level is at 0.6657, expected to provide support.
Note the levels of interest below:
- Pivot support is noted at 0.6614, 0.6587, 0.6554
- Pivot resistance is noted at 0.6674, 0.6707, 0.6734
| Levels | Levels.1 |
|---|---|
| Previous Daily High | 0.6680 |
| Previous Daily Low | 0.6620 |
| Previous Weekly High | 0.6793 |
| Previous Weekly Low | 0.6641 |
| Previous Monthly High | 0.6784 |
| Previous Monthly Low | 0.6564 |
| Daily Fibonacci 38.2% | 0.6643 |
| Daily Fibonacci 61.8% | 0.6657 |
| Daily Pivot Point S1 | 0.6614 |
| Daily Pivot Point S2 | 0.6587 |
| Daily Pivot Point S3 | 0.6554 |
| Daily Pivot Point R1 | 0.6674 |
| Daily Pivot Point R2 | 0.6707 |
| Daily Pivot Point R3 | 0.6734 |
[/s2If]
Join Our Telegram Group


