#NZDUSD @ 0.62144 struggles to capitalize on its modest intraday gains, though the downside seems limited. (Pivot Orderbook analysis)
…
This is a premium post.
[s2If !current_user_can(access_s2member_level4)]Please register for PREMIUM VERSION HERE to read full post below containing analysis. In case of any error or you think you are not able to read the full post below, please email us at support#nehcap.com [lwa][/s2If] [s2If current_user_can(access_s2member_level4)]
- NZD/USD struggles to capitalize on its modest intraday gains, though the downside seems limited.
- The softer Chinese inflation figures fuel concerns about slowing growth and weighs on the major.
- A positive risk tone undermines the safe-haven USD and lends support to the risk-sensitive Kiwi.
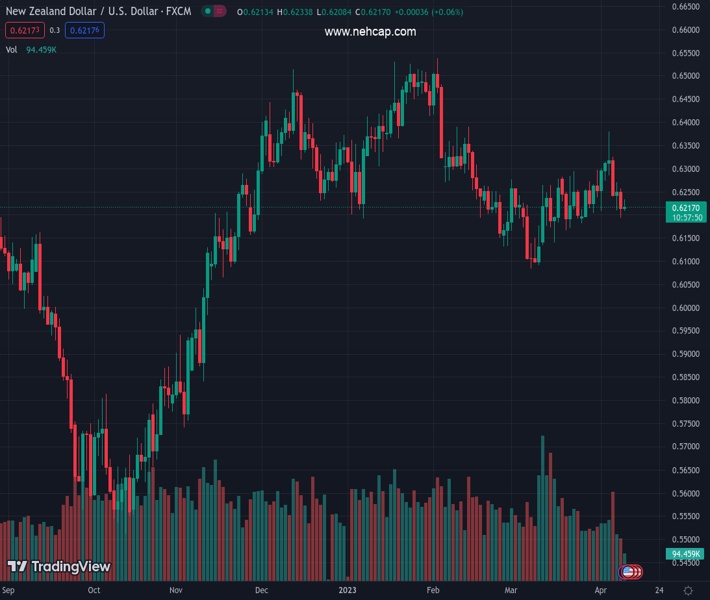
The pair currently trades last at 0.62144.
The previous day high was 0.6265 while the previous day low was 0.6193. The daily 38.2% Fib levels comes at 0.622, expected to provide resistance. Similarly, the daily 61.8% fib level is at 0.6237, expected to provide resistance.
The NZD/USD pair attracts fresh sellers following an intraday uptick to the 0.6235 area on Tuesday and drops to the lower end of its daily trading range during the first half of the European session. The pair is currently placed around the 0.6215-0.6210 region and remains well within the striking distance of a nearly two-week low touched on Monday.
Data released earlier today showed China’s consumer inflation hit an 18-month low and producer price inflation contracted at a steady pace amid growing signs that a post-COVID economic recovery was losing steam. This, in turn, is seen weighing on antipodean currencies, including the New Zealand Dollar, though broad-based US Dollar (USD) weakness helps limit the downside for the NZD/USD pair, at least for the time being.
A generally positive tone around the equity markets is seen as a key factor undermining the Greenback’s relative safe-haven status and lending some support to the risk-sensitive Kiwi. The USD downfall, however, is likely to remain cushioned amid speculations that the Federal Reserve (Fed) may continue raising interest rates. In fact, the current market pricing indicates a greater chance of a 25 bps lift-off at the next FOMC monetary policy meeting in May and the bets were lifted by the mostly upbeat US employment details (NFP) released on Friday.
The prospects for further policy tightening by the Fed, meanwhile, puts a floor under the US Treasury bond yields, which should further act as a tailwind for the buck and cap the upside for the NZD/USD pair. The mixed fundamental backdrop warrants some caution before placing aggressive directional bets ahead of this week’s important releases from the US – the latest consumer inflation figures and the FOMC meeting minutes on Wednesday. This, along with the US Retail Sales data on Friday, will drive the USD demand and provide a fresh directional impetus to the major.
Technical Levels: Supports and Resistances
NZDUSD currently trading at 0.6212 at the time of writing. Pair opened at 0.6217 and is trading with a change of -0.08 % .
| Overview | Overview.1 | |
|---|---|---|
| 0 | Today last price | 0.6212 |
| 1 | Today Daily Change | -0.0005 |
| 2 | Today Daily Change % | -0.0800 |
| 3 | Today daily open | 0.6217 |
The pair is trading below its 20 Daily moving average @ 0.6243, below its 50 Daily moving average @ 0.6254 , below its 100 Daily moving average @ 0.6303 and above its 200 Daily moving average @ 0.616
| Trends | Trends.1 | |
|---|---|---|
| 0 | Daily SMA20 | 0.6243 |
| 1 | Daily SMA50 | 0.6254 |
| 2 | Daily SMA100 | 0.6303 |
| 3 | Daily SMA200 | 0.6160 |
The previous day high was 0.6265 while the previous day low was 0.6193. The daily 38.2% Fib levels comes at 0.622, expected to provide resistance. Similarly, the daily 61.8% fib level is at 0.6237, expected to provide resistance.
Note the levels of interest below:
- Pivot support is noted at 0.6185, 0.6153, 0.6114
- Pivot resistance is noted at 0.6257, 0.6297, 0.6329
| Levels | Levels.1 |
|---|---|
| Previous Daily High | 0.6265 |
| Previous Daily Low | 0.6193 |
| Previous Weekly High | 0.6389 |
| Previous Weekly Low | 0.6207 |
| Previous Monthly High | 0.6298 |
| Previous Monthly Low | 0.6084 |
| Daily Fibonacci 38.2% | 0.6220 |
| Daily Fibonacci 61.8% | 0.6237 |
| Daily Pivot Point S1 | 0.6185 |
| Daily Pivot Point S2 | 0.6153 |
| Daily Pivot Point S3 | 0.6114 |
| Daily Pivot Point R1 | 0.6257 |
| Daily Pivot Point R2 | 0.6297 |
| Daily Pivot Point R3 | 0.6329 |
[/s2If]
Join Our Telegram Group


