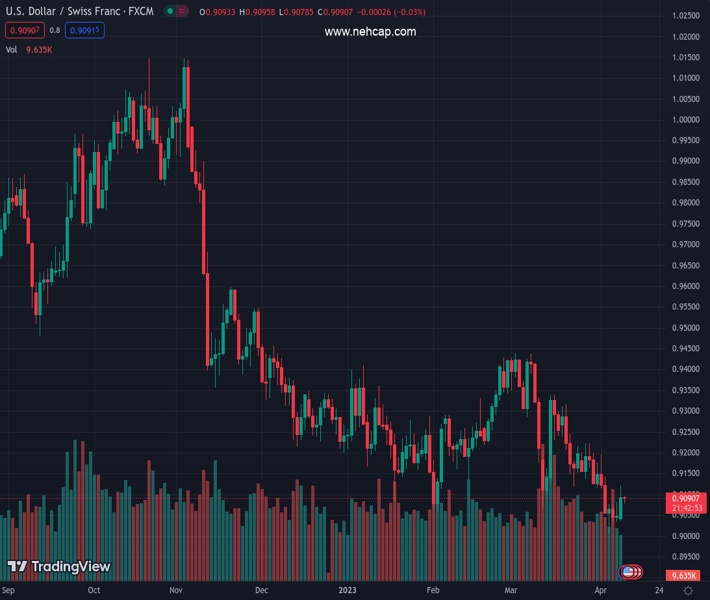
#USDCHF @ 0.90908 fades upside momentum after rising in the last two consecutive days. (Pivot Orderbook analysis)
…
This is a premium post.
[s2If !current_user_can(access_s2member_level4)]Please register for PREMIUM VERSION HERE to read full post below containing analysis. In case of any error or you think you are not able to read the full post below, please email us at support#nehcap.com [lwa][/s2If] [s2If current_user_can(access_s2member_level4)]
- USD/CHF fades upside momentum after rising in the last two consecutive days.
- US Dollar bulls seek more clues to extend four-day uptrend near one-week high.
- Friday’s upbeat NFP favored hawkish Fed bets and favored US Dollar of late, risk aversion also strengthened the greenback.
- Return of full markets, cautious mood ahead of top-tier data/events test Swiss pair traders.
The pair currently trades last at 0.90908.
The previous day high was 0.9082 while the previous day low was 0.9034. The daily 38.2% Fib levels comes at 0.9064, expected to provide support. Similarly, the daily 61.8% fib level is at 0.9052, expected to provide support.
USD/CHF retreats to 0.9090 during early Tuesday, snapping a two-day uptrend, as bulls turn cautious on full markets’ return after Good Friday and Easter Monday holidays. Also acting as an upside barrier for the Swiss Franc pair are the fresh doubts on the Federal Reserve’s (Fed) May month rate hikes.
That said, Rick Rieder, Chief Investment Officer of global fixed income at BlackRock, the world’s largest asset manager, said late Monday, “The Federal Reserve may not need to raise interest rates further to fight inflation, as the fallout from last month’s turmoil in the banking sector and a series of recent labor data point to a slowing US economy,” per Reuters.
On the other hand, Federal Reserve (Fed) Bank of New York President, as well as the Fed’s Vice Chairman of the rate-setting committee, John Williams anticipated slower inflation while ruling out the interest rates as culprits for the previous month’s bank fallouts.
That said, the US Dollar Index (DXY) eases to 102.55, around a one-week high, after rising in the last four consecutive days. The greenback’s gauge versus the six major currencies recently traced firmer US Treasury bond yields while cheering mostly upbeat US employment numbers. Adding strength to the US Dollar is the currency’s haven demand amid the geopolitical fears emanating from China, mainly concerning Taiwan.
Against this backdrop, Wall Street benchmarks closed mixed while the US 10-year and two-year Treasury bond yields rose to 3.41% and 4.0% at the latest.
Moving on, China’s headline inflation numbers for March, namely the Consumer Price Index (CPI) and Producer Price Index (PPI), can entertain USD/CHF pair traders but risk catalysts likely Fed bets and geopolitical concerns may gain major attention. Above all, Wednesday’s US CPI and Fed Minutes will be crucial for the pair traders to watch for clear directions.
A one-month-old descending resistance line, around 0.9155 by the press time, guards immediate upside of the USD/CHF pair.
Technical Levels: Supports and Resistances
USDCHF currently trading at 0.9092 at the time of writing. Pair opened at 0.9054 and is trading with a change of 0.42% % .
| Overview | Overview.1 | |
|---|---|---|
| 0 | Today last price | 0.9092 |
| 1 | Today Daily Change | 0.0038 |
| 2 | Today Daily Change % | 0.42% |
| 3 | Today daily open | 0.9054 |
The pair remains strongly bearish on the daily time frame. It trades below the 20 SMA @ 0.9168, 50 SMA 0.9236, 100 SMA @ 0.9277 and 200 SMA @ 0.9507.
| Trends | Trends.1 | |
|---|---|---|
| 0 | Daily SMA20 | 0.9168 |
| 1 | Daily SMA50 | 0.9236 |
| 2 | Daily SMA100 | 0.9277 |
| 3 | Daily SMA200 | 0.9507 |
The previous day high was 0.9082 while the previous day low was 0.9034. The daily 38.2% Fib levels comes at 0.9064, expected to provide support. Similarly, the daily 61.8% fib level is at 0.9052, expected to provide support.
Note the levels of interest below:
- Pivot support is noted at 0.9032, 0.901, 0.8985
- Pivot resistance is noted at 0.9079, 0.9104, 0.9126
| Levels | Levels.1 |
|---|---|
| Previous Daily High | 0.9082 |
| Previous Daily Low | 0.9034 |
| Previous Weekly High | 0.9198 |
| Previous Weekly Low | 0.9007 |
| Previous Monthly High | 0.9440 |
| Previous Monthly Low | 0.9072 |
| Daily Fibonacci 38.2% | 0.9064 |
| Daily Fibonacci 61.8% | 0.9052 |
| Daily Pivot Point S1 | 0.9032 |
| Daily Pivot Point S2 | 0.9010 |
| Daily Pivot Point S3 | 0.8985 |
| Daily Pivot Point R1 | 0.9079 |
| Daily Pivot Point R2 | 0.9104 |
| Daily Pivot Point R3 | 0.9126 |
[/s2If]
Join Our Telegram Group


