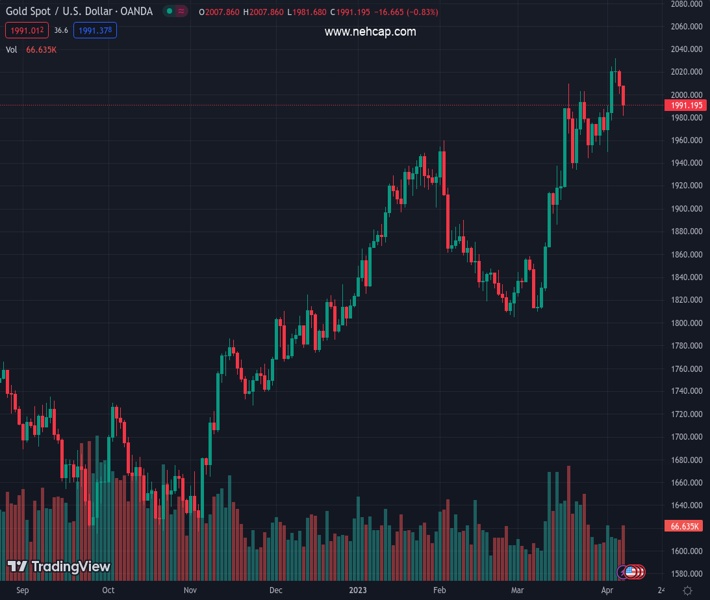
#XAUUSD @ 1,990.90 Gold price has stretched its recovery above $1,990.00, however, the downside remains favored. (Pivot Orderbook analysis)
…
This is a premium post.
[s2If !current_user_can(access_s2member_level4)]Please register for PREMIUM VERSION HERE to read full post below containing analysis. In case of any error or you think you are not able to read the full post below, please email us at support#nehcap.com [lwa][/s2If] [s2If current_user_can(access_s2member_level4)]
- Gold price has stretched its recovery above $1,990.00, however, the downside remains favored.
- US labor market conditions remained tight despite tight credit conditions from US banks and high rates from the Fed.
- A surprise rebound is expected in US core inflation as earnings data is still higher due to a shortage of labor.
The pair currently trades last at 1990.90.
The previous day high was 2021.5 while the previous day low was 2000.93. The daily 38.2% Fib levels comes at 2008.79, expected to provide resistance. Similarly, the daily 61.8% fib level is at 2013.64, expected to provide resistance.
Gold price (XAU/USD) showed a recovery move after printing a three-day low at $1,981.38 in the Asian session. The precious metal has stretched its recovery above $1,990.00 as the US Dollar Index (DXY) has witnessed a correction after a five-day high at 102.81. The recovery move in the Gold price could be a pullback move only and the downside journey would resume as investors are expected to remain anxious ahead of the United States inflation data, which is scheduled for Wednesday.
Meanwhile, S&P500 ended Monday’s session with nominal gains as the recovery move came post a gap-down opening due to volatility inspired by the extended weekend. The US Treasury Yields recovered losses and settled above 3.41% on Monday as the Federal Reserve (Fed) is expected to hike rates again next month.
Earlier, the street was anticipating that Fed chair Jerome Powell would consider an early pause in the policy-tightening spell as tight credit conditions and higher rates would slow down the economy dramatically. However, tight labor market conditions have confirmed that a shortage of labor would be there, which will be offset by higher offerings.
This week, the annual Average Hourly Earnings data softened further to 4.2% but is well above against consistency required to tame stubborn inflation.
Going forward, the US Consumer Price Index (CPI) data will remain in the spotlight. A surprise rebound in the US inflation would cement the need for one more rate hike from the Fed. As per the consensus, the headline inflation will soften to 5.2% from the former release of 6.0%. Also, monthly headline CPI would decelerate to 0.3% from 0.4% reported earlier. While annual core inflation that excludes oil and food prices could surprisingly jump to 5.6% from the former release of 5.5%.
Gold price has corrected sharply to near $1,987.00 after a breakout move from the Symmetrical Triangle chart pattern formed on a two-hour scale. The precious metal is at a make-or-a-break level as a breakdown from this level would trigger further weakness in the Gold price.
The 100-period Exponential Moving Average (EMA) at $1,991.00 is providing a cushion to the Gold price.
Meanwhile, the Relative Strength Index (RSI) (14) is defending itself from shifting into the bearish range of 20.00-40.00.
Technical Levels: Supports and Resistances
XAUUSD currently trading at 1991.35 at the time of writing. Pair opened at 2007.82 and is trading with a change of -0.82 % .
| Overview | Overview.1 | |
|---|---|---|
| 0 | Today last price | 1991.35 |
| 1 | Today Daily Change | -16.47 |
| 2 | Today Daily Change % | -0.82 |
| 3 | Today daily open | 2007.82 |
The pair remains strongly bullish on the daily timeframe. It trades above its 20 SMA @ 1962.7, 50 SMA 1898.83, 100 SMA @ 1862.26 and 200 SMA @ 1787.74.
| Trends | Trends.1 | |
|---|---|---|
| 0 | Daily SMA20 | 1962.70 |
| 1 | Daily SMA50 | 1898.83 |
| 2 | Daily SMA100 | 1862.26 |
| 3 | Daily SMA200 | 1787.74 |
The previous day high was 2021.5 while the previous day low was 2000.93. The daily 38.2% Fib levels comes at 2008.79, expected to provide resistance. Similarly, the daily 61.8% fib level is at 2013.64, expected to provide resistance.
Note the levels of interest below:
- Pivot support is noted at 1998.67, 1989.51, 1978.1
- Pivot resistance is noted at 2019.24, 2030.65, 2039.81
| Levels | Levels.1 |
|---|---|
| Previous Daily High | 2021.50 |
| Previous Daily Low | 2000.93 |
| Previous Weekly High | 2032.11 |
| Previous Weekly Low | 1949.83 |
| Previous Monthly High | 2009.88 |
| Previous Monthly Low | 1809.46 |
| Daily Fibonacci 38.2% | 2008.79 |
| Daily Fibonacci 61.8% | 2013.64 |
| Daily Pivot Point S1 | 1998.67 |
| Daily Pivot Point S2 | 1989.51 |
| Daily Pivot Point S3 | 1978.10 |
| Daily Pivot Point R1 | 2019.24 |
| Daily Pivot Point R2 | 2030.65 |
| Daily Pivot Point R3 | 2039.81 |
[/s2If]
Join Our Telegram Group


