The US Dollar Index edges higher for the fourth straight day on Monday, though lacks follow-through. (Pivot Orderbook analysis)
…
This is a premium post.
[s2If !current_user_can(access_s2member_level4)]Please register for PREMIUM VERSION HERE to read full post below containing analysis. In case of any error or you think you are not able to read the full post below, please email us at support#nehcap.com [lwa][/s2If] [s2If current_user_can(access_s2member_level4)]
- The US Dollar Index edges higher for the fourth straight day on Monday, though lacks follow-through.
- The upbeat US NFP report revives bets for additional Fed rate hikes and is seen underpinning the buck.
- Geopolitical tensions further benefit the safe-haven Greenback and remain supportive of the move up.
- Expectations that the Fed will cut rates during the second half of the year cap the upside for the USD.
The pair currently trades last at 102.16.
The previous day high was 102.29 while the previous day low was 101.88. The daily 38.2% Fib levels comes at 102.14, expected to provide support. Similarly, the daily 61.8% fib level is at 102.04, expected to provide support.
The US Dollar Index (DXY), which tracks the Greenback against a basket of currencies, kicks off the new week on a positive note and builds on its recent bounce from the lowest level since early February touched last Wednesday. This marks the fourth successive day of a positive move for the buck, though lacks follow-through or bullish conviction amid the uncertainty over the Federal Reserve’s (Fed) rate-hike path.
The mostly upbeat US monthly employment details released on Friday suggested that the US central bank may have to raise interest rates next month. In fact, the headline NFP showed that the US economy added 236K new jobs in March against market expectations for a reading of 240K. Furthermore, the jobless rate edged down to 3.5% from 3.6% the previous, while Average Hourly Earnings rose 0.3% during the reported month. The annual wage gains, meanwhile, slowed, though remain too high to be consistent with the Fed’s 2% inflation target and support prospects for further policy tightening.
Apart from this, the risk of a further escalation in tensions between the US and China is seen as another factor benefitting the Greenback’s relative safe-haven status. It is worth mentioning that China retaliated against Taiwan President Tsai Ing-wen’s US visit and carried out aggressive military drills around Taiwan on Monday. The de facto US embassy in Taiwan said on Sunday the US has sufficient resources and capabilities regionally to ensure peace and stability. This comes amid worries about a deeper global economic downturn, which continues to weigh on investors’ sentiment and drives some haven flows.
Market participants, however, seem convinced that the Fed will cut rates in the second half of the year and the expectations were fueled by the recent US macro data, which has been pointing to slowing economic growth. This, in turn, might hold back the USD bulls from placing aggressive bets and cap the upside ahead of the FOMC meeting minutes, due on Wednesday. This week’s US economic docket also features the release of the latest consumer inflation figures and monthly retail sales data, which if misses consensus estimates will take Fed rate-hike bets off the table and weigh on the USD.
Technical Levels: Supports and Resistances
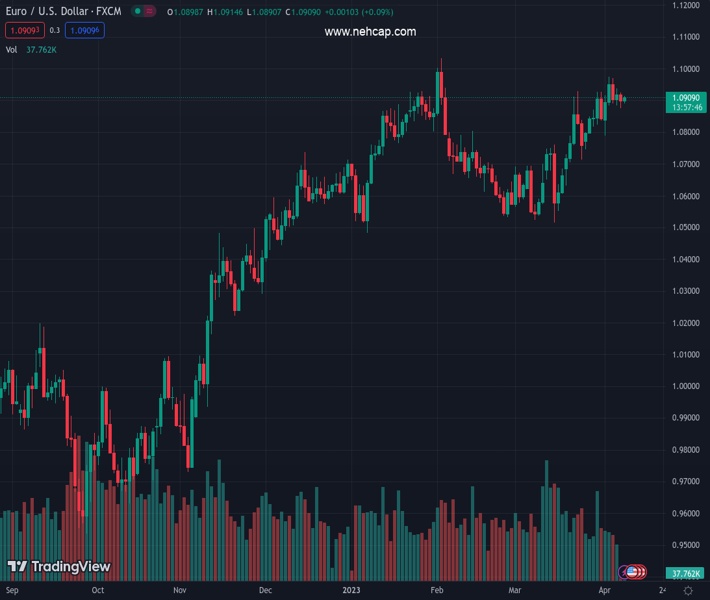
EURUSD currently trading at 102.16 at the time of writing. Pair opened at 102.12 and is trading with a change of 0.04 % .
| Overview | Overview.1 | |
|---|---|---|
| 0 | Today last price | 102.16 |
| 1 | Today Daily Change | 0.04 |
| 2 | Today Daily Change % | 0.04 |
| 3 | Today daily open | 102.12 |
The pair remains strongly bearish on the daily time frame. It trades below the 20 SMA @ 102.87, 50 SMA 103.49, 100 SMA @ 103.75 and 200 SMA @ 106.5.
| Trends | Trends.1 | |
|---|---|---|
| 0 | Daily SMA20 | 102.87 |
| 1 | Daily SMA50 | 103.49 |
| 2 | Daily SMA100 | 103.75 |
| 3 | Daily SMA200 | 106.50 |
The previous day high was 102.29 while the previous day low was 101.88. The daily 38.2% Fib levels comes at 102.14, expected to provide support. Similarly, the daily 61.8% fib level is at 102.04, expected to provide support.
Note the levels of interest below:
- Pivot support is noted at 101.9, 101.68, 101.48
- Pivot resistance is noted at 102.32, 102.51, 102.73
| Levels | Levels.1 |
|---|---|
| Previous Daily High | 102.29 |
| Previous Daily Low | 101.88 |
| Previous Weekly High | 103.06 |
| Previous Weekly Low | 101.41 |
| Previous Monthly High | 105.89 |
| Previous Monthly Low | 101.92 |
| Daily Fibonacci 38.2% | 102.14 |
| Daily Fibonacci 61.8% | 102.04 |
| Daily Pivot Point S1 | 101.90 |
| Daily Pivot Point S2 | 101.68 |
| Daily Pivot Point S3 | 101.48 |
| Daily Pivot Point R1 | 102.32 |
| Daily Pivot Point R2 | 102.51 |
| Daily Pivot Point R3 | 102.73 |
[/s2If]
Join Our Telegram Group


