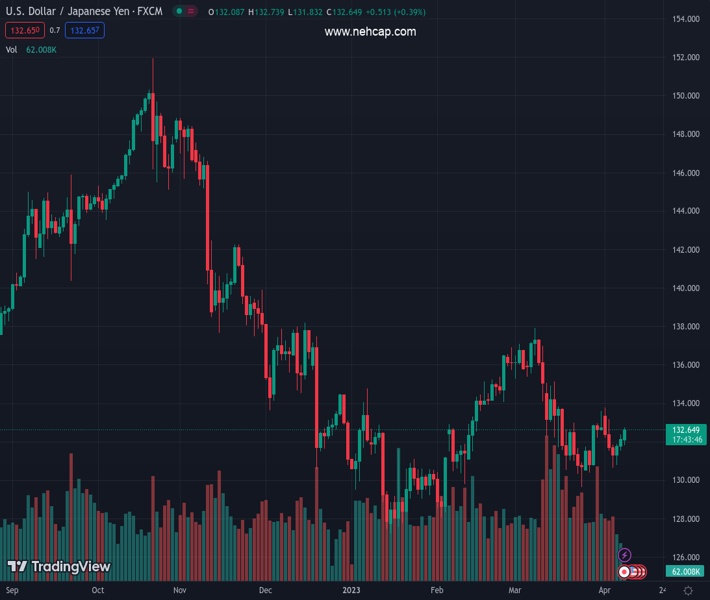
#USDJPY @ 132.651 prints three-day uptrend as it pokes one-month-old descending resistance line., @nehcap view: Further upside expected (Pivot Orderbook analysis)
…
This is a premium post.
[s2If !current_user_can(access_s2member_level4)]Please register for PREMIUM VERSION HERE to read full post below containing analysis. In case of any error or you think you are not able to read the full post below, please email us at support#nehcap.com [lwa][/s2If] [s2If current_user_can(access_s2member_level4)]
- USD/JPY prints three-day uptrend as it pokes one-month-old descending resistance line.
- Clear upside break of 21-DMA, firmer oscillators suggest the Yen pair’s further upside.
- Bearish need validation from 12-week-old ascending support line to retake control.
The pair currently trades last at 132.651.
The previous day high was 132.38 while the previous day low was 131.53. The daily 38.2% Fib levels comes at 132.05, expected to provide support. Similarly, the daily 61.8% fib level is at 131.85, expected to provide support.
USD/JPY buyers occupy the driver’s seat for the third consecutive day as they pierce a one-month-old descending resistance line near 132.65 during early Monday.
In doing so, the Yen pair justifies the upside break of the 21-DMA, the first in a monthly, while also taking clues from the upbeat oscillators. That said, the MACD portrays the strongest bullish signals in a month while the RSI (14) also grinds higher past the 50 level, suggesting a gradual run-up of the pair.
It’s worth noting, however, that the 50-DMA hurdle, around 133.20, appears a short-term key challenge for the USD/JPY buyers to pass if they wish to keep the reins.
Following that, a run-up towards a seven-week-old horizontal resistance area around 135.20, can’t be ruled out.
In a case where the USD/JPY pair remains firmer past 135.20, the Year-To-Date (YTD) high of 137.91 should lure the bulls before highlighting the 140.00 psychological magnet.
On the contrary, the Yen pair’s pullback remains elusive unless the quote stays past an upward-sloping support line from January 16, around 131.00 by the press time.
Even if the USD/JPY bears manage to conquer the 131.00 trend line support, the previous monthly low of around 129.65 can act as an extra filter towards the south ahead of directing the moves to the early 2023 bottom of 127.21.
Trend: Further upside expected
Technical Levels: Supports and Resistances
USDJPY currently trading at 132.62 at the time of writing. Pair opened at 132.17 and is trading with a change of 0.34% % .
| Overview | Overview.1 | |
|---|---|---|
| 0 | Today last price | 132.62 |
| 1 | Today Daily Change | 0.45 |
| 2 | Today Daily Change % | 0.34% |
| 3 | Today daily open | 132.17 |
The pair is trading above its 20 Daily moving average @ 132.17, below its 50 Daily moving average @ 133.12 , below its 100 Daily moving average @ 133.48 and below its 200 Daily moving average @ 137.22
| Trends | Trends.1 | |
|---|---|---|
| 0 | Daily SMA20 | 132.17 |
| 1 | Daily SMA50 | 133.12 |
| 2 | Daily SMA100 | 133.48 |
| 3 | Daily SMA200 | 137.22 |
The previous day high was 132.38 while the previous day low was 131.53. The daily 38.2% Fib levels comes at 132.05, expected to provide support. Similarly, the daily 61.8% fib level is at 131.85, expected to provide support.
Note the levels of interest below:
- Pivot support is noted at 131.67, 131.17, 130.82
- Pivot resistance is noted at 132.52, 132.87, 133.37
| Levels | Levels.1 |
|---|---|
| Previous Daily High | 132.38 |
| Previous Daily Low | 131.53 |
| Previous Weekly High | 133.76 |
| Previous Weekly Low | 130.63 |
| Previous Monthly High | 137.91 |
| Previous Monthly Low | 129.64 |
| Daily Fibonacci 38.2% | 132.05 |
| Daily Fibonacci 61.8% | 131.85 |
| Daily Pivot Point S1 | 131.67 |
| Daily Pivot Point S2 | 131.17 |
| Daily Pivot Point S3 | 130.82 |
| Daily Pivot Point R1 | 132.52 |
| Daily Pivot Point R2 | 132.87 |
| Daily Pivot Point R3 | 133.37 |
[/s2If]
Join Our Telegram Group


