#AUDJPY @ 88.1430 pair sees two straight days of losses as sellers remain in charge. (Pivot Orderbook analysis)
…
This is a premium post.
[s2If !current_user_can(access_s2member_level4)]Please register for PREMIUM VERSION HERE to read full post below containing analysis. In case of any error or you think you are not able to read the full post below, please email us at support#nehcap.com [lwa][/s2If] [s2If current_user_can(access_s2member_level4)]
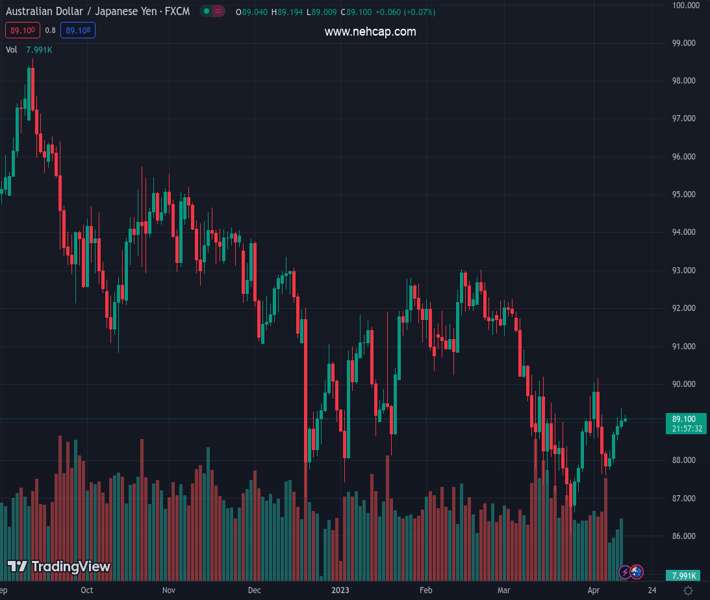
- AUD/JPY pair sees two straight days of losses as sellers remain in charge.
- A breach of 20-day EMA support at 88.81 opens the path for further decline.
The pair currently trades last at 88.1430.
The previous day high was 90.17 while the previous day low was 88.58. The daily 38.2% Fib levels comes at 89.19, expected to provide resistance. Similarly, the daily 61.8% fib level is at 89.56, expected to provide resistance.
With the AUD/JPY pair extending its losses to two-straight days and breaching the 20-day Exponential Moving Average (EMA) support at 88.81 has opened the path for sellers. After testing previous resistance at around 90.00, where a prior support trendline turned resistance, sellers gathered momentum, and since then, the AUD/JPY has dropped 2.86%.
Oscillators remain in bearish territory, with the Relative Strength Index (RSI) aiming lower, while the Rate of Change (RoC) portrays sellers remaining in charge.
In the short term, the AUD/JPY 1-hour chart portrays the pair correcting upwards, testing the 38.2% Fibonacci retracement around 88.24. Upside risks lie at the central pivot point at 88.33, which, once cleared, would expose the R1 daily pivot at 89.03. Nevertheless, the confluence of April’s 5 low and the 61.80% Fibonacci retracement at around 88.62 would cap any rallies. If AUD/JPY retreats at the latter, look for a slide toward the S2 daily pivot point at 86.77.
Technical Levels: Supports and Resistances
AUDJPY currently trading at 88.18 at the time of writing. Pair opened at 88.92 and is trading with a change of -0.83 % .
| Overview | Overview.1 | |
|---|---|---|
| 0 | Today last price | 88.18 |
| 1 | Today Daily Change | -0.74 |
| 2 | Today Daily Change % | -0.83 |
| 3 | Today daily open | 88.92 |
The pair remains strongly bearish on the daily time frame. It trades below the 20 SMA @ 88.63, 50 SMA 90.54, 100 SMA @ 90.91 and 200 SMA @ 92.58.
| Trends | Trends.1 | |
|---|---|---|
| 0 | Daily SMA20 | 88.63 |
| 1 | Daily SMA50 | 90.54 |
| 2 | Daily SMA100 | 90.91 |
| 3 | Daily SMA200 | 92.58 |
The previous day high was 90.17 while the previous day low was 88.58. The daily 38.2% Fib levels comes at 89.19, expected to provide resistance. Similarly, the daily 61.8% fib level is at 89.56, expected to provide resistance.
Note the levels of interest below:
- Pivot support is noted at 88.28, 87.64, 86.69
- Pivot resistance is noted at 89.86, 90.81, 91.45
| Levels | Levels.1 |
|---|---|
| Previous Daily High | 90.17 |
| Previous Daily Low | 88.58 |
| Previous Weekly High | 89.68 |
| Previous Weekly Low | 86.67 |
| Previous Monthly High | 92.25 |
| Previous Monthly Low | 86.06 |
| Daily Fibonacci 38.2% | 89.19 |
| Daily Fibonacci 61.8% | 89.56 |
| Daily Pivot Point S1 | 88.28 |
| Daily Pivot Point S2 | 87.64 |
| Daily Pivot Point S3 | 86.69 |
| Daily Pivot Point R1 | 89.86 |
| Daily Pivot Point R2 | 90.81 |
| Daily Pivot Point R3 | 91.45 |
[/s2If]
Join Our Telegram Group


