#EURUSD @ 1.09062 has shown recovery from 1.0900 amid signs of softening the US labor market. (Pivot Orderbook analysis)
…
This is a premium post.
[s2If !current_user_can(access_s2member_level4)]Please register for PREMIUM VERSION HERE to read full post below containing analysis. In case of any error or you think you are not able to read the full post below, please email us at support#nehcap.com [lwa][/s2If] [s2If current_user_can(access_s2member_level4)]
- EUR/USD has shown recovery from 1.0900 amid signs of softening the US labor market.
- US firms have slowed down their hiring process amid rising interest rates by the Fed and a bleak economic outlook.
- The ECB would continue its policy-tightening process ahead.
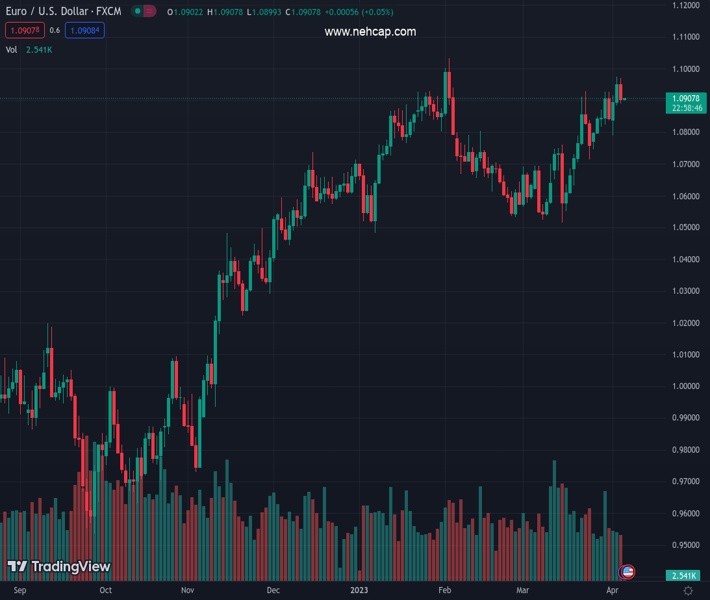
The pair currently trades last at 1.09062.
The previous day high was 1.0973 while the previous day low was 1.0883. The daily 38.2% Fib levels comes at 1.0939, expected to provide resistance. Similarly, the daily 61.8% fib level is at 1.0917, expected to provide resistance.
The EUR/USD pair has sensed support after dropping to near the round-level support of 1.0900 in the early Asian session. The major currency pair has attempted a recovery after falling to near 1.0900 as the tight United States labor market has cooled down further after US Employment data released by Automatic Data Processing (ADP) missed estimates.
As per the released data, the US economy added 145K jobs in March, significantly lower than the estimates of 200K and the former release of 242K. Firms have slowed down their hiring process amid rising interest rates by the Federal Reserve (Fed) and a bleak economic outlook. A slowdown in the recruitment process after the release of weak Job Openings data indicates that the US labor market has started cooling off and chances are solid of an escalation in the Unemployment Rate ahead.
Meanwhile, S&P500 settled Wednesday’s session with some losses as the risk of recession has been fuelled further after the release of the downbeat US ISM Services PMI data, portraying a risk appetite theme. The US Dollar Index (DXY) rebounded to near 102.00 after defending the fresh monthly low above 102.40. The demand for US government bonds soared as weak Services PMI and a slowdown in payroll numbers have confirmed that the Fed will favor an unchanged interest rate decision ahead. The 10-year US Treasury yields have sipped sharply below 3.31%.
In Eurozone, the survey of consumer expectations for inflation, conducted by the European Central Bank (ECB) on a monthly basis showed that median inflation expectations for the next 12 months have fallen to 4.6% in February vs. 4.9% recorded in January. Constantly rising rates by European Central Bank President Christine Lagarde to tame sticky Eurozone inflation has trimmed consumer inflation expectations.
Technical Levels: Supports and Resistances
EURUSD currently trading at 1.0905 at the time of writing. Pair opened at 1.0953 and is trading with a change of -0.44 % .
| Overview | Overview.1 | |
|---|---|---|
| 0 | Today last price | 1.0905 |
| 1 | Today Daily Change | -0.0048 |
| 2 | Today Daily Change % | -0.4400 |
| 3 | Today daily open | 1.0953 |
The pair remains strongly bullish on the daily timeframe. It trades above its 20 SMA @ 1.0755, 50 SMA 1.0734, 100 SMA @ 1.0663 and 200 SMA @ 1.0345.
| Trends | Trends.1 | |
|---|---|---|
| 0 | Daily SMA20 | 1.0755 |
| 1 | Daily SMA50 | 1.0734 |
| 2 | Daily SMA100 | 1.0663 |
| 3 | Daily SMA200 | 1.0345 |
The previous day high was 1.0973 while the previous day low was 1.0883. The daily 38.2% Fib levels comes at 1.0939, expected to provide resistance. Similarly, the daily 61.8% fib level is at 1.0917, expected to provide resistance.
Note the levels of interest below:
- Pivot support is noted at 1.09, 1.0846, 1.0809
- Pivot resistance is noted at 1.099, 1.1027, 1.1081
| Levels | Levels.1 |
|---|---|
| Previous Daily High | 1.0973 |
| Previous Daily Low | 1.0883 |
| Previous Weekly High | 1.0926 |
| Previous Weekly Low | 1.0745 |
| Previous Monthly High | 1.0930 |
| Previous Monthly Low | 1.0516 |
| Daily Fibonacci 38.2% | 1.0939 |
| Daily Fibonacci 61.8% | 1.0917 |
| Daily Pivot Point S1 | 1.0900 |
| Daily Pivot Point S2 | 1.0846 |
| Daily Pivot Point S3 | 1.0809 |
| Daily Pivot Point R1 | 1.0990 |
| Daily Pivot Point R2 | 1.1027 |
| Daily Pivot Point R3 | 1.1081 |
[/s2If]
Join Our Telegram Group


