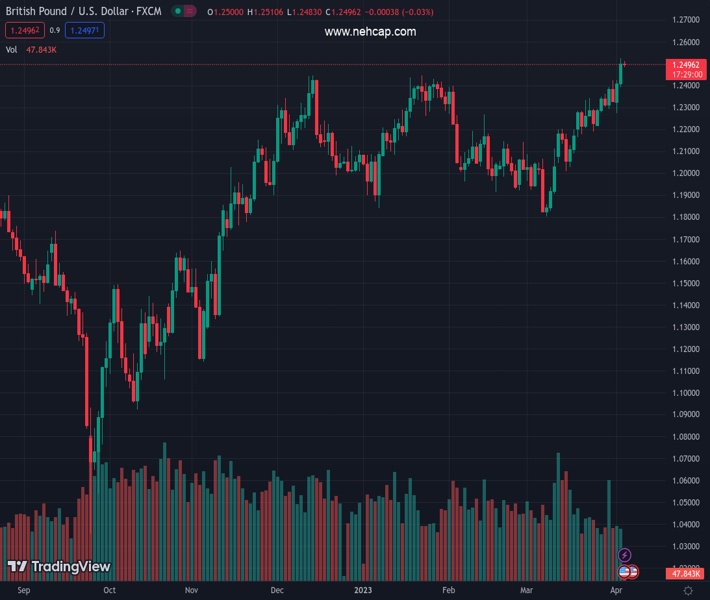
#GBPUSD @ 1.24977 seesaws around multi-month high after rising the most in three weeks. (Pivot Orderbook analysis)
…
This is a premium post.
[s2If !current_user_can(access_s2member_level4)]Please register for PREMIUM VERSION HERE to read full post below containing analysis. In case of any error or you think you are not able to read the full post below, please email us at support#nehcap.com [lwa][/s2If] [s2If current_user_can(access_s2member_level4)]
- GBP/USD seesaws around multi-month high after rising the most in three weeks.
- US Dollar’s corrective bounce from five-week low, pre-data anxiety prods Cable buyers at the highest levels since June 2022.
- Mixed concerns about Bank of England (BoE) versus Federal Reserve play challenge GBP/USD traders of late.
- Final readings of US/UK PMIs, US ADP Employment Change eyed for fresh impulse.
The pair currently trades last at 1.24977.
The previous day high was 1.2525 while the previous day low was 1.2395. The daily 38.2% Fib levels comes at 1.2476, expected to provide support. Similarly, the daily 61.8% fib level is at 1.2445, expected to provide support.
GBP/USD bulls jostle with the bears at the 10-month high surrounding 1.2500 as they await the key US/UK data during early Wednesday. Not only cautious mood ahead of the important statistics but corrective bounces in the US Dollar and yields also allow the Cable pair buyers to take a breather of late.
On Tuesday, the Cable pair rallied the most in three weeks as it jumped to the June 2022 levels on broad US Dollar weakness, as well as hawkish Bank of England (BoE) officials’ comments.
That said, the US Dollar Index (DXY) dropped to the lowest levels in five weeks on Tuesday, before renewing the multi-day bottom and then bouncing off the 101.43 level to around 101.54 by the press time. It’s worth noting that the downbeat US data and the greenback’s less acceptance among the key global trade players weigh on the US Dollar of late.
Talking about the data, the US JOLTS Job Openings dropped to the lowest levels since May 2021 while flashing a 9.931M figure for February versus 10.4M expected and 10.563M revised prior. On the same line, US Factory Orders for February came in -0.7% MoM versus -0.5% expected and downwardly revised -2.1% prior.
It should be noted that Russia’s latest likes for the Chinese Tuan and the China-Brazil pact to ignore the US Dollar as an intermediate currency seem to drag the US Dollar.
On the other hand, Bank of England (BoE) Chief Economist Huw Pill said on Tuesday that caution is still needed in assessing inflation prospects on account of the potential persistence of domestically generated inflation, as reported by Reuters. However, BoE Policymaker Silvana Tenreyro said, “I expect that the high current level of bank rate will require an earlier and faster reversal, to avoid a significant inflation undershoot.”
Earlier in the day, Federal Reserve Bank of Cleveland leader Loretta Mester recently cited the need to hike rates above 5% and hold them there for a while.
While portraying the mood, the S&P 500 Futures print mild gains even as Wall Street closed with minor losses. Further, the US 10-year and two-year Treasury bond yields also take a breather around 3.35% and 3.85% respectively, after falling in the last four and three consecutive days.
Looking ahead, final readings of the UK’s S&P Global Composite PMI and Services PMI for March can offer immediate directions to the Cable pair ahead of the US ISM Services PMI and ADP Employment Change for March.
Also read: US ADP Jobs/ISM Service PMI Preview: Slowing but still positive
The existence of a one-month-old rising wedge bearish chart pattern, currently between 1.2550 and 1.2390, teases the GBP/USD pair sellers to take a risk as the RSI (14) line is near the overbought territory.
Technical Levels: Supports and Resistances
GBPUSD currently trading at 1.2498 at the time of writing. Pair opened at 1.2502 and is trading with a change of -0.03% % .
| Overview | Overview.1 | |
|---|---|---|
| 0 | Today last price | 1.2498 |
| 1 | Today Daily Change | -0.0004 |
| 2 | Today Daily Change % | -0.03% |
| 3 | Today daily open | 1.2502 |
The pair remains strongly bullish on the daily timeframe. It trades above its 20 SMA @ 1.2217, 50 SMA 1.2153, 100 SMA @ 1.2143 and 200 SMA @ 1.1897.
| Trends | Trends.1 | |
|---|---|---|
| 0 | Daily SMA20 | 1.2217 |
| 1 | Daily SMA50 | 1.2153 |
| 2 | Daily SMA100 | 1.2143 |
| 3 | Daily SMA200 | 1.1897 |
The previous day high was 1.2525 while the previous day low was 1.2395. The daily 38.2% Fib levels comes at 1.2476, expected to provide support. Similarly, the daily 61.8% fib level is at 1.2445, expected to provide support.
Note the levels of interest below:
- Pivot support is noted at 1.2423, 1.2344, 1.2293
- Pivot resistance is noted at 1.2553, 1.2604, 1.2683
| Levels | Levels.1 |
|---|---|
| Previous Daily High | 1.2525 |
| Previous Daily Low | 1.2395 |
| Previous Weekly High | 1.2424 |
| Previous Weekly Low | 1.2219 |
| Previous Monthly High | 1.2424 |
| Previous Monthly Low | 1.1803 |
| Daily Fibonacci 38.2% | 1.2476 |
| Daily Fibonacci 61.8% | 1.2445 |
| Daily Pivot Point S1 | 1.2423 |
| Daily Pivot Point S2 | 1.2344 |
| Daily Pivot Point S3 | 1.2293 |
| Daily Pivot Point R1 | 1.2553 |
| Daily Pivot Point R2 | 1.2604 |
| Daily Pivot Point R3 | 1.2683 |
[/s2If]
Join Our Telegram Group


