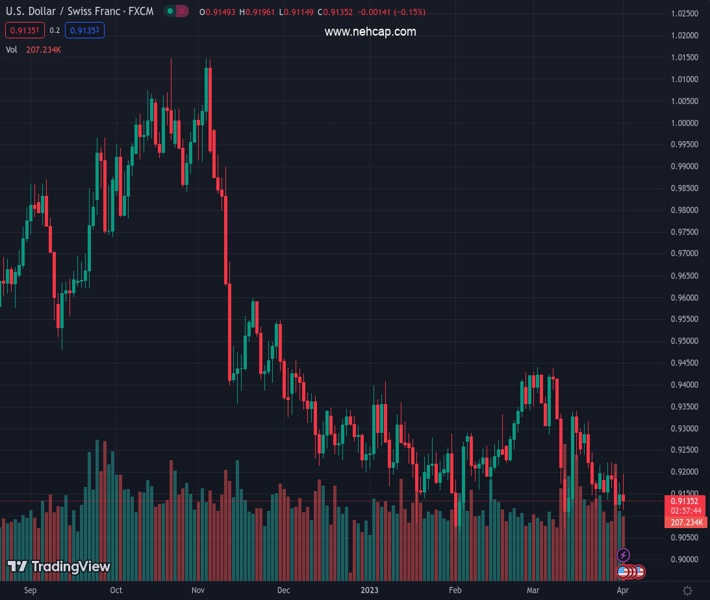
#USDCHF @ 0.91357 S&P Global and ISN Manufacturing PMIs entered the recessionary territory as economic conditions in the US tightened. (Pivot Orderbook analysis)
…
This is a premium post.
[s2If !current_user_can(access_s2member_level4)]Please register for PREMIUM VERSION HERE to read full post below containing analysis. In case of any error or you think you are not able to read the full post below, please email us at support#nehcap.com [lwa][/s2If] [s2If current_user_can(access_s2member_level4)]
- S&P Global and ISN Manufacturing PMIs entered the recessionary territory as economic conditions in the US tightened.
- US Treasury bond yields and USD plummet following poor US manufacturing data.
- USD/CHF Price Analysis: A symmetrical triangle in downtrend warrants further low prices.
The pair currently trades last at 0.91357.
The previous day high was 0.9178 while the previous day low was 0.9116. The daily 38.2% Fib levels comes at 0.9154, expected to provide resistance. Similarly, the daily 61.8% fib level is at 0.9139, expected to provide resistance.
USD/CHF tumbles 0.17% after hitting a daily high of 0.9196 on softer-than-expected inflation in Switzerland. Nevertheless, a weaker manufacturing activity report from the US reversed the USD/CHF pair course, as investors estimated the US Federal Reserve (Fed) would pause raising rates. At the time of typing, the USD/CHF is trading at 0.9137.
The Swiss Franc (CHF) got bolstered after US economic data, namely the S&P Global and ISM Manufacturing PMIs, came worse than estimated. The S&P Global Manufacturing PMI for March was 49.2, below 49.3 estimates. Later, the Institute for Supply Management (ISM) revealed its Manufacturing PMI, which plunged to 46.3, below the 47.5 foresaw and below February’s data.
Consequently, US Treasury bond yields and the US Dollar (USD) plunged. The USD/CHF extended its losses past the 0.9150 area, hitting a low of 0.9115.
The US Dollar Index (DXY), which tracks the performance of six currencies vs. the US Dollar, drops 0.39%, down to 102.196. the US 2 and 10-year Treasury bond yields are dropping two and four basis points each, at 4.005% and 3.430%, respectively.
Inflation in Switzerland came softer thane expected, with headline data at 2.9% YoY vs. 3.2% estimates. Core inflation rose by 2.2% YoY, below the 2.5% foreseen in February. In March, the Swiss National Bank (SNB) lifted rates by 50 bps to 1.50%, and its Governor, Thomas Jordan, said, “ It cannot be ruled out that additional rises in the SNB policy rate will be necessary to ensure price stability over the medium term.”
From a daily chart perspective, the USD/CHF is extending its downtrend. After forming a descending triangle in a downtrend, the USD/CHF broke below its bottom trendline, suggesting that further downside is expected. Therefore, the USD/CHF first support would be 0.9115. A breach of the latter will expose the figure at 0.9100, immediately followed by 0.9059.
Technical Levels: Supports and Resistances
USDCHF currently trading at 0.9135 at the time of writing. Pair opened at 0.915 and is trading with a change of -0.16 % .
| Overview | Overview.1 | |
|---|---|---|
| 0 | Today last price | 0.9135 |
| 1 | Today Daily Change | -0.0015 |
| 2 | Today Daily Change % | -0.1600 |
| 3 | Today daily open | 0.9150 |
The pair remains strongly bearish on the daily time frame. It trades below the 20 SMA @ 0.9236, 50 SMA 0.925, 100 SMA @ 0.9297 and 200 SMA @ 0.9519.
| Trends | Trends.1 | |
|---|---|---|
| 0 | Daily SMA20 | 0.9236 |
| 1 | Daily SMA50 | 0.9250 |
| 2 | Daily SMA100 | 0.9297 |
| 3 | Daily SMA200 | 0.9519 |
The previous day high was 0.9178 while the previous day low was 0.9116. The daily 38.2% Fib levels comes at 0.9154, expected to provide resistance. Similarly, the daily 61.8% fib level is at 0.9139, expected to provide resistance.
Note the levels of interest below:
- Pivot support is noted at 0.9118, 0.9086, 0.9056
- Pivot resistance is noted at 0.918, 0.921, 0.9242
| Levels | Levels.1 |
|---|---|
| Previous Daily High | 0.9178 |
| Previous Daily Low | 0.9116 |
| Previous Weekly High | 0.9224 |
| Previous Weekly Low | 0.9116 |
| Previous Monthly High | 0.9440 |
| Previous Monthly Low | 0.9072 |
| Daily Fibonacci 38.2% | 0.9154 |
| Daily Fibonacci 61.8% | 0.9139 |
| Daily Pivot Point S1 | 0.9118 |
| Daily Pivot Point S2 | 0.9086 |
| Daily Pivot Point S3 | 0.9056 |
| Daily Pivot Point R1 | 0.9180 |
| Daily Pivot Point R2 | 0.9210 |
| Daily Pivot Point R3 | 0.9242 |
[/s2If]
Join Our Telegram Group


