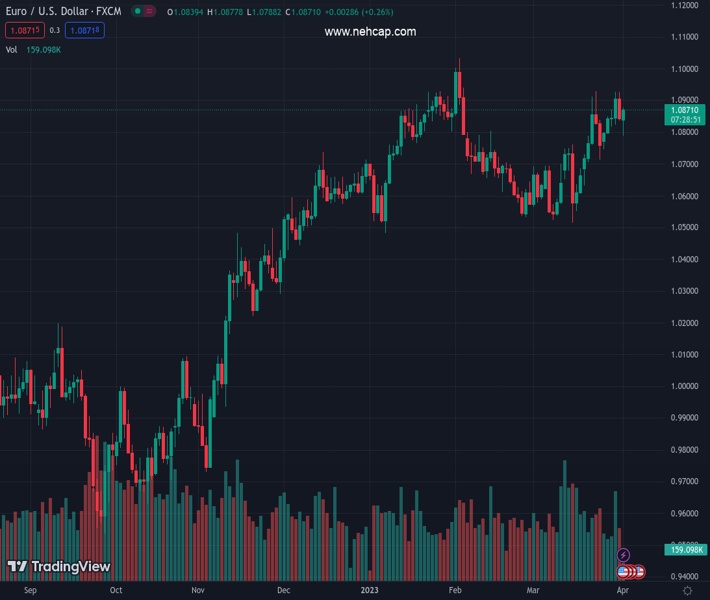
#EURUSD @ 1.08729 leaves behind the earlier drop to the sub-1.0800 region. (Pivot Orderbook analysis)
…
This is a premium post.
[s2If !current_user_can(access_s2member_level4)]Please register for PREMIUM VERSION HERE to read full post below containing analysis. In case of any error or you think you are not able to read the full post below, please email us at support#nehcap.com [lwa][/s2If] [s2If current_user_can(access_s2member_level4)]
- EUR/USD leaves behind the earlier drop to the sub-1.0800 region.
- Further gains continue to target monthly peaks in the 1.0930 area.
The pair currently trades last at 1.08729.
The previous day high was 1.0926 while the previous day low was 1.0837. The daily 38.2% Fib levels comes at 1.0871, expected to provide support. Similarly, the daily 61.8% fib level is at 1.0892, expected to provide resistance.
EUR/USD bounces off earlier lows in the proximity of 1.0790 and regains the 1.0880 region in a volatile start of the new trading week.
The likelihood of extra advances appears favoured for the time being. Against that, the pair could now set sail to the March peak at 1.0929 (March 23) prior to a potential test of the 2023 high at 1.1032 (February 2).
Looking at the longer run, the constructive view remains unchanged while above the 200-day SMA, today at 1.0341.
Technical Levels: Supports and Resistances
EURUSD currently trading at 1.0871 at the time of writing. Pair opened at 1.084 and is trading with a change of 0.29 % .
| Overview | Overview.1 | |
|---|---|---|
| 0 | Today last price | 1.0871 |
| 1 | Today Daily Change | 89.0000 |
| 2 | Today Daily Change % | 0.2900 |
| 3 | Today daily open | 1.0840 |
The pair remains strongly bullish on the daily timeframe. It trades above its 20 SMA @ 1.0724, 50 SMA 1.0732, 100 SMA @ 1.0651 and 200 SMA @ 1.0342.
| Trends | Trends.1 | |
|---|---|---|
| 0 | Daily SMA20 | 1.0724 |
| 1 | Daily SMA50 | 1.0732 |
| 2 | Daily SMA100 | 1.0651 |
| 3 | Daily SMA200 | 1.0342 |
The previous day high was 1.0926 while the previous day low was 1.0837. The daily 38.2% Fib levels comes at 1.0871, expected to provide support. Similarly, the daily 61.8% fib level is at 1.0892, expected to provide resistance.
Note the levels of interest below:
- Pivot support is noted at 1.0809, 1.0779, 1.072
- Pivot resistance is noted at 1.0898, 1.0956, 1.0987
| Levels | Levels.1 |
|---|---|
| Previous Daily High | 1.0926 |
| Previous Daily Low | 1.0837 |
| Previous Weekly High | 1.0926 |
| Previous Weekly Low | 1.0745 |
| Previous Monthly High | 1.0930 |
| Previous Monthly Low | 1.0516 |
| Daily Fibonacci 38.2% | 1.0871 |
| Daily Fibonacci 61.8% | 1.0892 |
| Daily Pivot Point S1 | 1.0809 |
| Daily Pivot Point S2 | 1.0779 |
| Daily Pivot Point S3 | 1.0720 |
| Daily Pivot Point R1 | 1.0898 |
| Daily Pivot Point R2 | 1.0956 |
| Daily Pivot Point R3 | 1.0987 |
[/s2If]
Join Our Telegram Group


