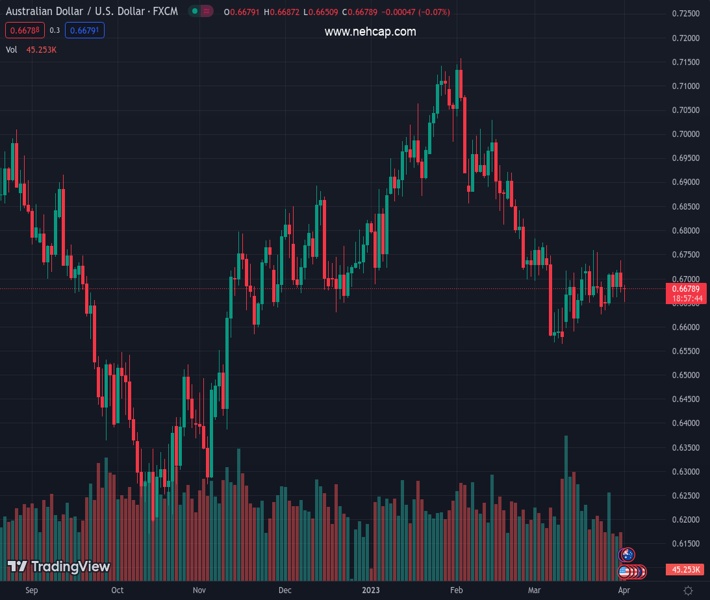
#AUDUSD @ 0.66796 remains pressured around one week low, fades bounce off intraday low of late. (Pivot Orderbook analysis)
…
This is a premium post.
[s2If !current_user_can(access_s2member_level4)]Please register for PREMIUM VERSION HERE to read full post below containing analysis. In case of any error or you think you are not able to read the full post below, please email us at support#nehcap.com [lwa][/s2If] [s2If current_user_can(access_s2member_level4)]
- AUD/USD remains pressured around one week low, fades bounce off intraday low of late.
- China Caixin Manufacturing PMI for March ease to 50.0 versus 51.7 expected and 51.6 prior.
- Australia Building Permits for February prod AUD/USD sellers.
- Sour sentiment, pre-NFP anxiety joins dovish bias for RBA to weigh on the Aussie pair.
The pair currently trades last at 0.66796.
The previous day high was 0.6738 while the previous day low was 0.667. The daily 38.2% Fib levels comes at 0.6696, expected to provide resistance. Similarly, the daily 61.8% fib level is at 0.6712, expected to provide resistance.
AUD/USD struggles to overcome intraday losses as the latest statistics from China and Australia join sour sentiment during early Monday. That said, the Aussie pair holds lower ground near 0.6665 by the press time amid fears of RBA’s dovish hike and softer US data surrounding activities and employment.
That said, China’s Caixin Manufacturing PMI for March drops to 50.0 from 51.6 prior and 51.7 market forecasts.
Further, Australia’s TD Securities Inflation eased to 0.3% MoM and 5.7% YoY for March versus 0.4% and 6.3% respective priors, which in turn joins the previous week’s downbeat inflation and Retail Sales figures from the Pacific major to strengthen the dovish bias for the Reserve Bank of Australia’s (RBA) next move.
Earlier in the day, news surrounding the OPEC+ output cut weighed on the sentiment and the AUD/USD prices as less energy output suggests a further increase in the Oil price and more pressure on Inflation.
It’s worth observing that the CME’s FedWatch Tool recently suggests an increase in the hawkish bias for the Federal Reserve’s (Fed) 0.25% rate hike in May, versus less than 50% chances supporting the event seems in the last week., which in turn weigh on the AUD/USD prices.
Given the risk-off mood and mixed signals, AUD/USD pair may remain pressured around the short-term key support line. However, Monday’s US ISM PMI and Tuesday’s RBA Interest Rate Decision will be the key event for the Aussie pair traders to watch for clear directions.
Also read: AUD/USD approaches 0.6670 key support with eyes on RBA, US NFP
Recently steady RSI (14) and bullish MACD signals join a three-week-old ascending support line to challenge AUD/USD bears near 0.6670, a break of which can direct AUD/USD bears towards the previous monthly low surrounding 0.6560. Meanwhile, recovery remains elusive unless crossing the 200-DMA hurdle of near 0.6750 by the press time.
Technical Levels: Supports and Resistances
AUDUSD currently trading at 0.6669 at the time of writing. Pair opened at 0.6686 and is trading with a change of -0.25% % .
| Overview | Overview.1 | |
|---|---|---|
| 0 | Today last price | 0.6669 |
| 1 | Today Daily Change | -0.0017 |
| 2 | Today Daily Change % | -0.25% |
| 3 | Today daily open | 0.6686 |
The pair is trading above its 20 Daily moving average @ 0.6662, below its 50 Daily moving average @ 0.6819 , below its 100 Daily moving average @ 0.68 and below its 200 Daily moving average @ 0.6752
| Trends | Trends.1 | |
|---|---|---|
| 0 | Daily SMA20 | 0.6662 |
| 1 | Daily SMA50 | 0.6819 |
| 2 | Daily SMA100 | 0.6800 |
| 3 | Daily SMA200 | 0.6752 |
The previous day high was 0.6738 while the previous day low was 0.667. The daily 38.2% Fib levels comes at 0.6696, expected to provide resistance. Similarly, the daily 61.8% fib level is at 0.6712, expected to provide resistance.
Note the levels of interest below:
- Pivot support is noted at 0.6658, 0.6631, 0.6591
- Pivot resistance is noted at 0.6725, 0.6765, 0.6793
| Levels | Levels.1 |
|---|---|
| Previous Daily High | 0.6738 |
| Previous Daily Low | 0.6670 |
| Previous Weekly High | 0.6738 |
| Previous Weekly Low | 0.6634 |
| Previous Monthly High | 0.6784 |
| Previous Monthly Low | 0.6564 |
| Daily Fibonacci 38.2% | 0.6696 |
| Daily Fibonacci 61.8% | 0.6712 |
| Daily Pivot Point S1 | 0.6658 |
| Daily Pivot Point S2 | 0.6631 |
| Daily Pivot Point S3 | 0.6591 |
| Daily Pivot Point R1 | 0.6725 |
| Daily Pivot Point R2 | 0.6765 |
| Daily Pivot Point R3 | 0.6793 |
[/s2If]
Join Our Telegram Group


