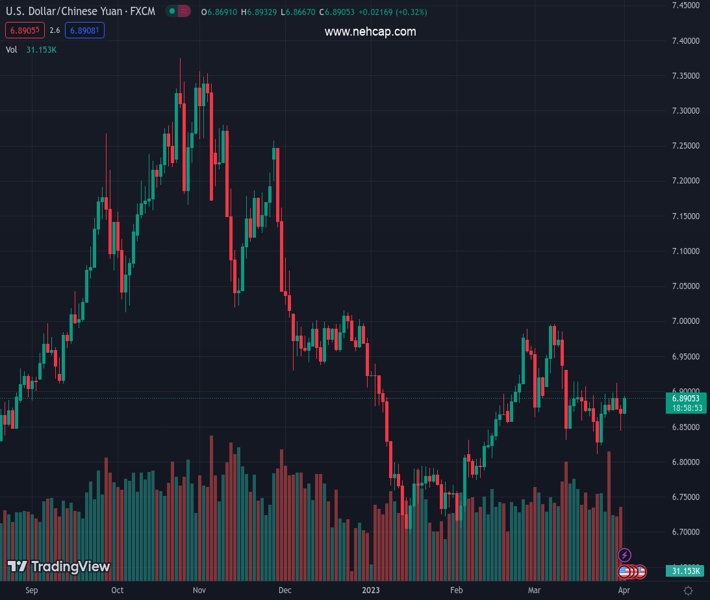
#USDCNH @ 6.88913 is having a smooth ride towards 6.90 on weaker-than-anticipated Caixin Manufacturing PMI data. (Pivot Orderbook analysis)
…
This is a premium post.
[s2If !current_user_can(access_s2member_level4)]Please register for PREMIUM VERSION HERE to read full post below containing analysis. In case of any error or you think you are not able to read the full post below, please email us at support#nehcap.com [lwa][/s2If] [s2If current_user_can(access_s2member_level4)]
- USD/CNH is having a smooth ride towards 6.90 on weaker-than-anticipated Caixin Manufacturing PMI data.
- The Chinese Yuan is expected to remain on the backfoot as oil prices have soared dramatically.
- Higher oil prices are expected to spur the prices of goods and services at factory gates ahead.
The pair currently trades last at 6.88913.
The previous day high was 6.881 while the previous day low was 6.8438. The daily 38.2% Fib levels comes at 6.8581, expected to provide support. Similarly, the daily 61.8% fib level is at 6.8668, expected to provide support.
The USD/CNH pair has turned speedy towards the immediate resistance of 6.90 as the IHS Markit has reported a downbeat Caixin Manufacturing PMI data. The economic data has landed at 50.0, lower than the consensus of 51.7 and the former release of 51.5.
The Chinese Yuan is expected to remain on the backfoot as oil prices have raised dramatically after OPEC+ announced a further increase in production cuts to support oil prices. According to Reuters, the oil cartel will cut the overall oil production by around 1.16 million barrels/day (bpd), which will lead to the overall pledge of production cut to 3.66 million bpd.
It is worth noting that higher oil prices will significantly weigh on the oil price as China is the largest importer of oil in the world. Higher oil prices would result in more outflows from the Chinese current account for refilling oil.
S&P500 futures have generated some losses in the Asian session in hopes that higher oil prices would propel inflation risk again, portraying a decline in the risk appetite of the market participants.
The US Dollar Index (DXY) has resumed its upside journey after a marginal correction to near 102.80. The USD Index is expected to reclaim its weekly high of 102.95. More gains for the USD Index are in pipeline as fears of renewed United States inflation have strengthened. Higher oil prices are expected to spur the prices of goods and services at factory gates to offset the impact of the former, which would propel inflationary pressures ahead.
The Federal Reserve (Fed) is expected to continue its policy tightening process further to tame the stubborn inflation. As per the CME Fedwatch tool, the odds for a 25bp rate hike to 5.00-5.25% for May monetary policy meeting have escalated to 57%.
Technical Levels: Supports and Resistances
USDCNH currently trading at 6.887 at the time of writing. Pair opened at 6.8704 and is trading with a change of 0.24 % .
| Overview | Overview.1 | |
|---|---|---|
| 0 | Today last price | 6.8870 |
| 1 | Today Daily Change | 0.0166 |
| 2 | Today Daily Change % | 0.2400 |
| 3 | Today daily open | 6.8704 |
The pair is trading below its 20 Daily moving average @ 6.8972, above its 50 Daily moving average @ 6.8597 , below its 100 Daily moving average @ 6.9142 and below its 200 Daily moving average @ 6.9365
| Trends | Trends.1 | |
|---|---|---|
| 0 | Daily SMA20 | 6.8972 |
| 1 | Daily SMA50 | 6.8597 |
| 2 | Daily SMA100 | 6.9142 |
| 3 | Daily SMA200 | 6.9365 |
The previous day high was 6.881 while the previous day low was 6.8438. The daily 38.2% Fib levels comes at 6.8581, expected to provide support. Similarly, the daily 61.8% fib level is at 6.8668, expected to provide support.
Note the levels of interest below:
- Pivot support is noted at 6.8491, 6.8279, 6.8119
- Pivot resistance is noted at 6.8863, 6.9023, 6.9235
| Levels | Levels.1 |
|---|---|
| Previous Daily High | 6.8810 |
| Previous Daily Low | 6.8438 |
| Previous Weekly High | 6.9124 |
| Previous Weekly Low | 6.8438 |
| Previous Monthly High | 6.9970 |
| Previous Monthly Low | 6.8104 |
| Daily Fibonacci 38.2% | 6.8581 |
| Daily Fibonacci 61.8% | 6.8668 |
| Daily Pivot Point S1 | 6.8491 |
| Daily Pivot Point S2 | 6.8279 |
| Daily Pivot Point S3 | 6.8119 |
| Daily Pivot Point R1 | 6.8863 |
| Daily Pivot Point R2 | 6.9023 |
| Daily Pivot Point R3 | 6.9235 |
[/s2If]
Join Our Telegram Group


