#GBPUSD @ 1.22988 bears are back in town after three-week uptrend as Cable news intraday low., @nehcap view: Further downside expected (Pivot Orderbook analysis)
…
This is a premium post.
[s2If !current_user_can(access_s2member_level4)]Please register for PREMIUM VERSION HERE to read full post below containing analysis. In case of any error or you think you are not able to read the full post below, please email us at support#nehcap.com [lwa][/s2If] [s2If current_user_can(access_s2member_level4)]
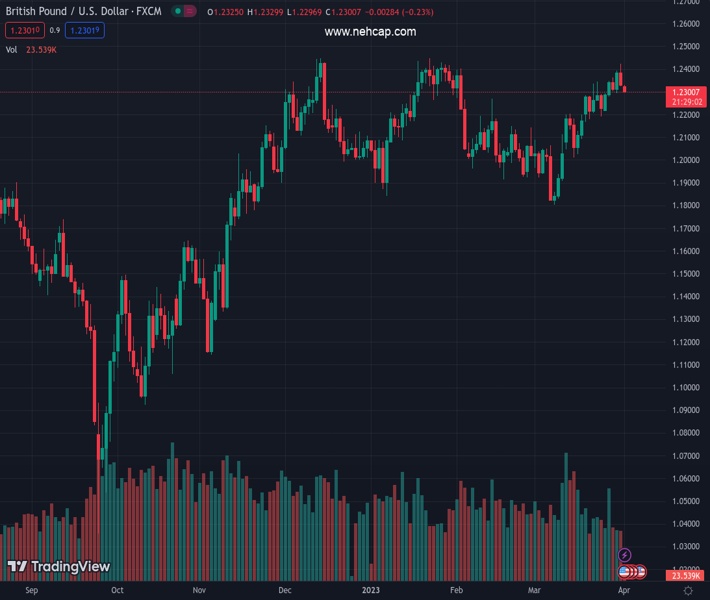
- GBP/USD bears are back in town after three-week uptrend as Cable news intraday low.
- Another failure to cross 1.2445-50 resistance zone, downside break of 13-day-old ascending support line lures sellers.
- Convergence of 50-DMA, 100-DMA appears the key support for bears to watch.
- Oscillators also suggest that buyers are running out of steam.
The pair currently trades last at 1.22988.
The previous day high was 1.2424 while the previous day low was 1.2324. The daily 38.2% Fib levels comes at 1.2362, expected to provide resistance. Similarly, the daily 61.8% fib level is at 1.2386, expected to provide resistance.
GBP/USD begins the week’s trading on a back foot after witnessing three consecutive weekly gains in the last, down 0.25% around 1.2310 by the press time.
In doing so, the Cable pair justifies the downside break of a two-week-old ascending support line, now resistance around 1.2365. Adding strength to the quote’s bearish bias is one more reversal from the 1.2445-50 resistance zone which has been restricting the quote’s upside since early December 2022.
Additionally, a looming bear cross on the MACD and a steady RSI (14) line also suggest that the GBP/USD pair could consolidate the latest weekly gains.
However, a convergence of the 50-DMA and 100-DMA, near 1.2140-45, appears a tough nut to crack for the Cable pair bears.
Following that, an upward-sloping support line from November, close to 1.1940 by the press time, can challenge the GBP/USD pair sellers.
Meanwhile, recovery moves not only need validation from the support-turned-resistance line of around 1.2365 but also need to provide a successful upside break of the 1.2445-50 area to convince the GBP/USD buyers.
Should the Cable pair manage to remain firmer past 1.2450, a run-up toward the May 2022 high of around 1.2665 can’t be ruled out.
Trend: Further downside expected
Technical Levels: Supports and Resistances
GBPUSD currently trading at 1.2311 at the time of writing. Pair opened at 1.2338 and is trading with a change of -0.22% % .
| Overview | Overview.1 | |
|---|---|---|
| 0 | Today last price | 1.2311 |
| 1 | Today Daily Change | -0.0027 |
| 2 | Today Daily Change % | -0.22% |
| 3 | Today daily open | 1.2338 |
The pair remains strongly bullish on the daily timeframe. It trades above its 20 SMA @ 1.2163, 50 SMA 1.2149, 100 SMA @ 1.213 and 200 SMA @ 1.1895.
| Trends | Trends.1 | |
|---|---|---|
| 0 | Daily SMA20 | 1.2163 |
| 1 | Daily SMA50 | 1.2149 |
| 2 | Daily SMA100 | 1.2130 |
| 3 | Daily SMA200 | 1.1895 |
The previous day high was 1.2424 while the previous day low was 1.2324. The daily 38.2% Fib levels comes at 1.2362, expected to provide resistance. Similarly, the daily 61.8% fib level is at 1.2386, expected to provide resistance.
Note the levels of interest below:
- Pivot support is noted at 1.23, 1.2262, 1.2201
- Pivot resistance is noted at 1.2399, 1.2461, 1.2499
| Levels | Levels.1 |
|---|---|
| Previous Daily High | 1.2424 |
| Previous Daily Low | 1.2324 |
| Previous Weekly High | 1.2424 |
| Previous Weekly Low | 1.2219 |
| Previous Monthly High | 1.2424 |
| Previous Monthly Low | 1.1803 |
| Daily Fibonacci 38.2% | 1.2362 |
| Daily Fibonacci 61.8% | 1.2386 |
| Daily Pivot Point S1 | 1.2300 |
| Daily Pivot Point S2 | 1.2262 |
| Daily Pivot Point S3 | 1.2201 |
| Daily Pivot Point R1 | 1.2399 |
| Daily Pivot Point R2 | 1.2461 |
| Daily Pivot Point R3 | 1.2499 |
[/s2If]
Join Our Telegram Group


