#EURUSD @ 1.08810 US February Core PCE inflation comes in at 4.6%, below 4.7% expected. (Pivot Orderbook analysis)
…
This is a premium post.
[s2If !current_user_can(access_s2member_level4)]Please register for PREMIUM VERSION HERE to read full post below containing analysis. In case of any error or you think you are not able to read the full post below, please email us at support#nehcap.com [lwa][/s2If] [s2If current_user_can(access_s2member_level4)]
- US February Core PCE inflation comes in at 4.6%, below 4.7% expected.
- US yields hits fresh daily lows, US Dollar weakens.
- EUR/USD erases most of it day’s losses after numbers.
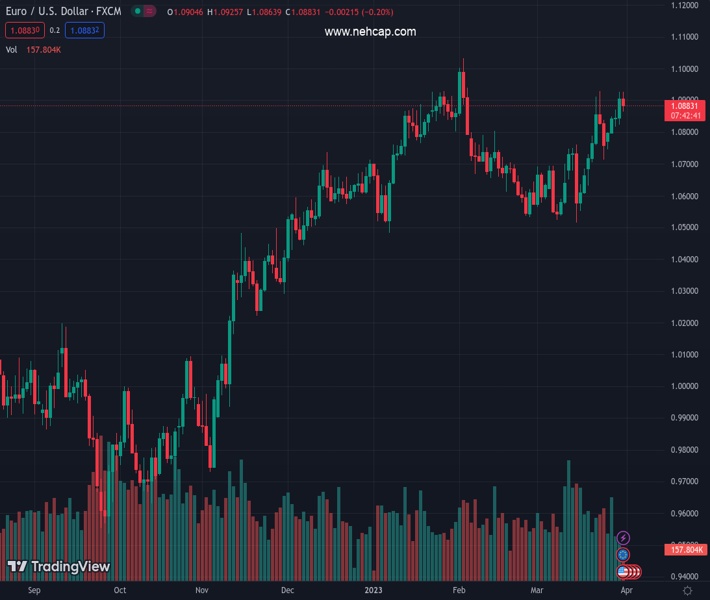
The pair currently trades last at 1.08810.
The previous day high was 1.0926 while the previous day low was 1.0824. The daily 38.2% Fib levels comes at 1.0887, expected to provide resistance. Similarly, the daily 61.8% fib level is at 1.0863, expected to provide support.
The EUR/USD rose from 1.0866 to 1.0895 following the release of US Core Consumer inflation that came in slightly below expectations. The figures weighed on the US Dollar that lost ground across the board.
The Core Personal Consumption Expenditures Price Index rose 0.3% in February, less than the 0.4% of market consensus to an annual rate of 4.6%, below the 4.7% of January. The PCE Price Index rose 0.3% in February and 5% YoY. The same report showed that Personal income grew by 0.3%, above the 0.2% expected while Personal Spending rose by 0.5%, surpassing consensus of 0.3%
The numbers showed consumer inflation in the US falling slowly. The February core CPE matched the lowest reading in 15 months. Those numbers could be welcome by the Fed, but still shows inflation remains elevated. The Chicago PMI and University of Michigan’s Consumer Confidence will be released later on Friday.
In the Eurozone, the Harmonised CPI came in softer at 6.9% YoY in March, down from 8.5%, below expectations of a drop to 7.1%. The Core CPI steadied at 5.7% YoY.
The US Dollar fell moderately across the board after the report as US yields sank. The 10-year Treasury yield fell from 3.54% to 3.51%, the lowest since Tuesday. The DXY is still up for the day, but it moved off highs.
The EUR/USD moved to the upside, approaching 1.0900. Still it remains below that relevant area. Earlier it peaked at 1.0925, before turning to the downside. It bottomed at 1.0863. On a weekly basis, the pair is heading toward the highest close in a year.
In the short term, the pair is moving with a bullish bias but is being unable to break the 1.0925/30 resistance and shows difficulties holding above 1.0900. Downward correction could find support at 1.0855/60 and 1.0820.
Technical Levels: Supports and Resistances
EURUSD currently trading at 1.0886 at the time of writing. Pair opened at 1.0905 and is trading with a change of -0.17 % .
| Overview | Overview.1 | |
|---|---|---|
| 0 | Today last price | 1.0886 |
| 1 | Today Daily Change | -0.0019 |
| 2 | Today Daily Change % | -0.1700 |
| 3 | Today daily open | 1.0905 |
The pair remains strongly bullish on the daily timeframe. It trades above its 20 SMA @ 1.0714, 50 SMA 1.0732, 100 SMA @ 1.0646 and 200 SMA @ 1.034.
| Trends | Trends.1 | |
|---|---|---|
| 0 | Daily SMA20 | 1.0714 |
| 1 | Daily SMA50 | 1.0732 |
| 2 | Daily SMA100 | 1.0646 |
| 3 | Daily SMA200 | 1.0340 |
The previous day high was 1.0926 while the previous day low was 1.0824. The daily 38.2% Fib levels comes at 1.0887, expected to provide resistance. Similarly, the daily 61.8% fib level is at 1.0863, expected to provide support.
Note the levels of interest below:
- Pivot support is noted at 1.0844, 1.0782, 1.0741
- Pivot resistance is noted at 1.0947, 1.0988, 1.105
| Levels | Levels.1 |
|---|---|
| Previous Daily High | 1.0926 |
| Previous Daily Low | 1.0824 |
| Previous Weekly High | 1.0930 |
| Previous Weekly Low | 1.0631 |
| Previous Monthly High | 1.1033 |
| Previous Monthly Low | 1.0533 |
| Daily Fibonacci 38.2% | 1.0887 |
| Daily Fibonacci 61.8% | 1.0863 |
| Daily Pivot Point S1 | 1.0844 |
| Daily Pivot Point S2 | 1.0782 |
| Daily Pivot Point S3 | 1.0741 |
| Daily Pivot Point R1 | 1.0947 |
| Daily Pivot Point R2 | 1.0988 |
| Daily Pivot Point R3 | 1.1050 |
[/s2If]
Join Our Telegram Group


