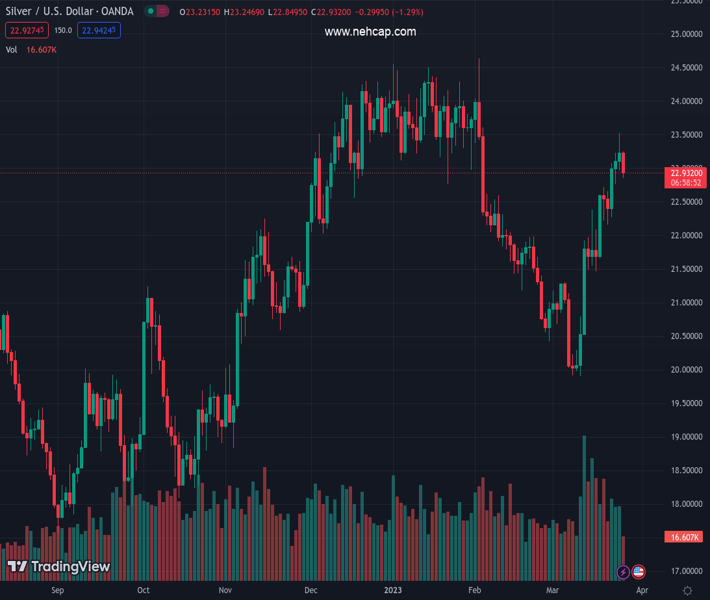
#XAGUSD @ 22.950 The grey metal trades on the defensive below $23.00. (Pivot Orderbook analysis)
…
This is a premium post.
[s2If !current_user_can(access_s2member_level4)]Please register for PREMIUM VERSION HERE to read full post below containing analysis. In case of any error or you think you are not able to read the full post below, please email us at support#nehcap.com [lwa][/s2If] [s2If current_user_can(access_s2member_level4)]
- The grey metal trades on the defensive below $23.00.
- Recent tops near $23.50 caps the upside so far.
- There is an interim support at the 100-day SMA ($23.48).
The pair currently trades last at 22.950.
The previous day high was 23.52 while the previous day low was 22.97. The daily 38.2% Fib levels comes at 23.31, expected to provide resistance. Similarly, the daily 61.8% fib level is at 23.18, expected to provide resistance.
Prices of the ounce of silver starts the new trading week on the defensive and retreat for the first time after three consecutive daily advances on Monday, probing at the same time the sub-$23.00 region.
In fact, silver comes under renewed selling pressure despite the so far bearish performance in the greenback and soon after hitting fresh multi-week peaks just beyond $23.50 on March 24.
In case the bullish mood returns to the market, the industrial metal is expected to meet the next up barrier at the March top at $23.52 (March 24). The surpass of this level should put silver en route to a potential visit to the 2023 peak at $24.62 (February 2) ahead of the April 2022 high at $26.21 (April 18). If losses accelerate, then there are provisional contention at the 100- and 55-day SMAs at $22.48 and $22.35, respectively, prior to the minor support level at $21.47 (low March 16). Further down comes the key 200-day SMA at $20.96, which precedes the 2023 low at $19.90 (March 10).
Technical Levels: Supports and Resistances
XAGUSD currently trading at 22.88 at the time of writing. Pair opened at 23.24 and is trading with a change of -1.55 % .
| Overview | Overview.1 | |
|---|---|---|
| 0 | Today last price | 22.88 |
| 1 | Today Daily Change | 41.00 |
| 2 | Today Daily Change % | -1.55 |
| 3 | Today daily open | 23.24 |
The pair remains strongly bullish on the daily timeframe. It trades above its 20 SMA @ 21.51, 50 SMA 22.24, 100 SMA @ 22.48 and 200 SMA @ 20.98.
| Trends | Trends.1 | |
|---|---|---|
| 0 | Daily SMA20 | 21.51 |
| 1 | Daily SMA50 | 22.24 |
| 2 | Daily SMA100 | 22.48 |
| 3 | Daily SMA200 | 20.98 |
The previous day high was 23.52 while the previous day low was 22.97. The daily 38.2% Fib levels comes at 23.31, expected to provide resistance. Similarly, the daily 61.8% fib level is at 23.18, expected to provide resistance.
Note the levels of interest below:
- Pivot support is noted at 22.97, 22.69, 22.41
- Pivot resistance is noted at 23.52, 23.8, 24.08
| Levels | Levels.1 |
|---|---|
| Previous Daily High | 23.52 |
| Previous Daily Low | 22.97 |
| Previous Weekly High | 23.52 |
| Previous Weekly Low | 22.16 |
| Previous Monthly High | 24.64 |
| Previous Monthly Low | 20.42 |
| Daily Fibonacci 38.2% | 23.31 |
| Daily Fibonacci 61.8% | 23.18 |
| Daily Pivot Point S1 | 22.97 |
| Daily Pivot Point S2 | 22.69 |
| Daily Pivot Point S3 | 22.41 |
| Daily Pivot Point R1 | 23.52 |
| Daily Pivot Point R2 | 23.80 |
| Daily Pivot Point R3 | 24.08 |
[/s2If]
Join Our Telegram Group


