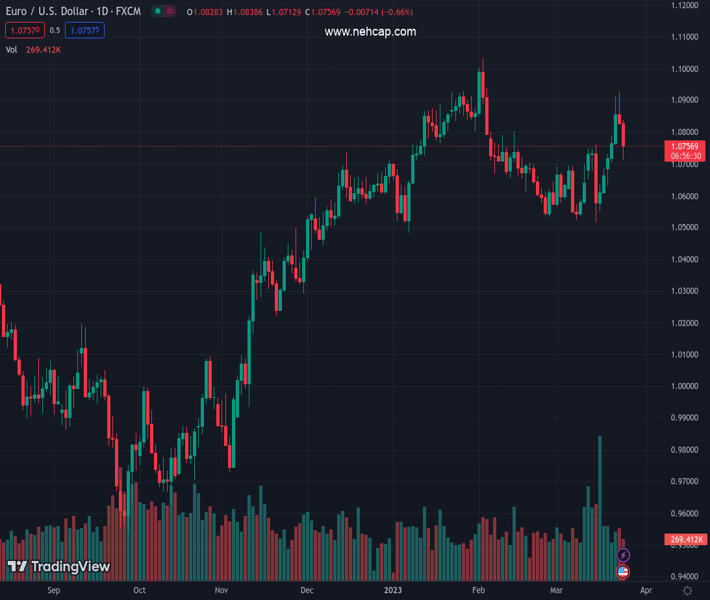
#EURUSD @ 1.07562 adds to Thursday’s decline and approaches 1.0700. (Pivot Orderbook analysis)
…
This is a premium post.
[s2If !current_user_can(access_s2member_level4)]Please register for PREMIUM VERSION HERE to read full post below containing analysis. In case of any error or you think you are not able to read the full post below, please email us at support#nehcap.com [lwa][/s2If] [s2If current_user_can(access_s2member_level4)]
- EUR/USD adds to Thursday’s decline and approaches 1.0700.
- A deeper drop could revisit the 100-day SMA near 1.0615.
The pair currently trades last at 1.07562.
The previous day high was 1.093 while the previous day low was 1.0824. The daily 38.2% Fib levels comes at 1.0865, expected to provide resistance. Similarly, the daily 61.8% fib level is at 1.0889, expected to provide resistance.
EUR/USD accelerates losses and sinks well south of 1.0800 the figure at the end of the week.
The corrective move could extend further in the near term and could put the 100-day SMA around 1.0615 back on the traders’ radar. Below the latter emerges the March low at 1.0516 (March 15).
Looking at the longer run, the constructive view remains unchanged while above the 200-day SMA, today at 1.0332.
Technical Levels: Supports and Resistances
EURUSD currently trading at 1.0763 at the time of writing. Pair opened at 1.0831 and is trading with a change of -0.63 % .
| Overview | Overview.1 | |
|---|---|---|
| 0 | Today last price | 1.0763 |
| 1 | Today Daily Change | 112.0000 |
| 2 | Today Daily Change % | -0.6300 |
| 3 | Today daily open | 1.0831 |
The pair remains strongly bullish on the daily timeframe. It trades above its 20 SMA @ 1.0656, 50 SMA 1.073, 100 SMA @ 1.0607 and 200 SMA @ 1.0333.
| Trends | Trends.1 | |
|---|---|---|
| 0 | Daily SMA20 | 1.0656 |
| 1 | Daily SMA50 | 1.0730 |
| 2 | Daily SMA100 | 1.0607 |
| 3 | Daily SMA200 | 1.0333 |
The previous day high was 1.093 while the previous day low was 1.0824. The daily 38.2% Fib levels comes at 1.0865, expected to provide resistance. Similarly, the daily 61.8% fib level is at 1.0889, expected to provide resistance.
Note the levels of interest below:
- Pivot support is noted at 1.0794, 1.0756, 1.0688
- Pivot resistance is noted at 1.0899, 1.0967, 1.1005
| Levels | Levels.1 |
|---|---|
| Previous Daily High | 1.0930 |
| Previous Daily Low | 1.0824 |
| Previous Weekly High | 1.0760 |
| Previous Weekly Low | 1.0516 |
| Previous Monthly High | 1.1033 |
| Previous Monthly Low | 1.0533 |
| Daily Fibonacci 38.2% | 1.0865 |
| Daily Fibonacci 61.8% | 1.0889 |
| Daily Pivot Point S1 | 1.0794 |
| Daily Pivot Point S2 | 1.0756 |
| Daily Pivot Point S3 | 1.0688 |
| Daily Pivot Point R1 | 1.0899 |
| Daily Pivot Point R2 | 1.0967 |
| Daily Pivot Point R3 | 1.1005 |
[/s2If]
Join Our Telegram Group


