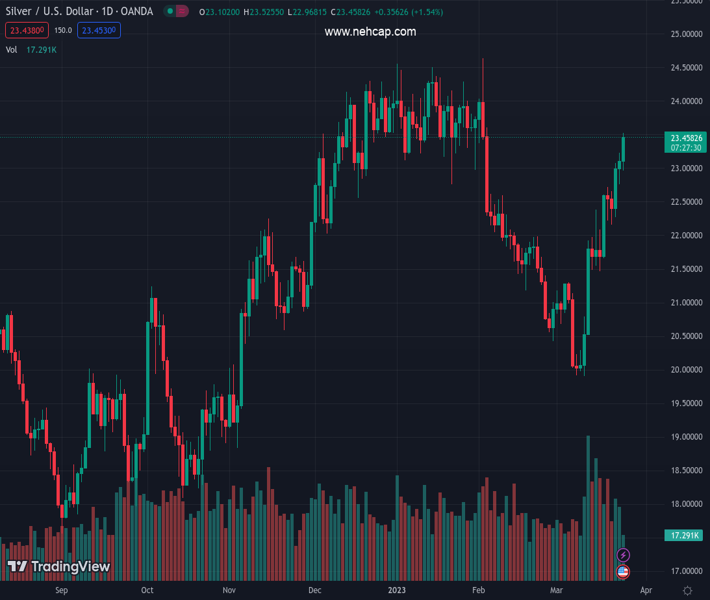
#XAGUSD @ 23.385 Silver outperforms gold on Friday, XAG/XAU ratio at one-month lows. (Pivot Orderbook analysis)
…
This is a premium post.
[s2If !current_user_can(access_s2member_level4)]Please register for PREMIUM VERSION HERE to read full post below containing analysis. In case of any error or you think you are not able to read the full post below, please email us at support#nehcap.com [lwa][/s2If] [s2If current_user_can(access_s2member_level4)]
- Silver outperforms gold on Friday, XAG/XAU ratio at one-month lows.
- Price hit $22.50 for the first time since early February.
The pair currently trades last at 23.385.
The previous day high was 23.22 while the previous day low was 22.76. The daily 38.2% Fib levels comes at 23.05, expected to provide support. Similarly, the daily 61.8% fib level is at 22.94, expected to provide support.
Silver jumped during the last hour, climbing from $23.16 to $23.52, reaching the highest level since early February. Gold is algo rising, trading at weekly highs slightly above $2,000.
Since the beginning of the week, XAG/USD has gained 4% and from the March 10 low, almost 20%. Price is testing a relevant technical area and a consolidation above $23.50 could keep the road to more gains clear, even as technical indicators show extreme overbought conditions.
Friday’s rally in metals takes place amid a deterioration in market sentiment. Wall Street futures trade in negative on renewed bank concerns. At the same time, the decline in US bond yields offers support to the rally in Gold.
However, Silver is outperforming Gold on Friday and also during the week. The ratio peaked early in March and since then it trended lower. It is back at February levels.
Technical Levels: Supports and Resistances
XAGUSD currently trading at 23.39 at the time of writing. Pair opened at 23.11 and is trading with a change of 1.21 % .
| Overview | Overview.1 | |
|---|---|---|
| 0 | Today last price | 23.39 |
| 1 | Today Daily Change | 0.28 |
| 2 | Today Daily Change % | 1.21 |
| 3 | Today daily open | 23.11 |
The pair remains strongly bullish on the daily timeframe. It trades above its 20 SMA @ 21.39, 50 SMA 22.26, 100 SMA @ 22.46 and 200 SMA @ 20.97.
| Trends | Trends.1 | |
|---|---|---|
| 0 | Daily SMA20 | 21.39 |
| 1 | Daily SMA50 | 22.26 |
| 2 | Daily SMA100 | 22.46 |
| 3 | Daily SMA200 | 20.97 |
The previous day high was 23.22 while the previous day low was 22.76. The daily 38.2% Fib levels comes at 23.05, expected to provide support. Similarly, the daily 61.8% fib level is at 22.94, expected to provide support.
Note the levels of interest below:
- Pivot support is noted at 22.84, 22.57, 22.37
- Pivot resistance is noted at 23.3, 23.5, 23.77
| Levels | Levels.1 |
|---|---|
| Previous Daily High | 23.22 |
| Previous Daily Low | 22.76 |
| Previous Weekly High | 22.61 |
| Previous Weekly Low | 20.54 |
| Previous Monthly High | 24.64 |
| Previous Monthly Low | 20.42 |
| Daily Fibonacci 38.2% | 23.05 |
| Daily Fibonacci 61.8% | 22.94 |
| Daily Pivot Point S1 | 22.84 |
| Daily Pivot Point S2 | 22.57 |
| Daily Pivot Point S3 | 22.37 |
| Daily Pivot Point R1 | 23.30 |
| Daily Pivot Point R2 | 23.50 |
| Daily Pivot Point R3 | 23.77 |
[/s2If]
Join Our Telegram Group


