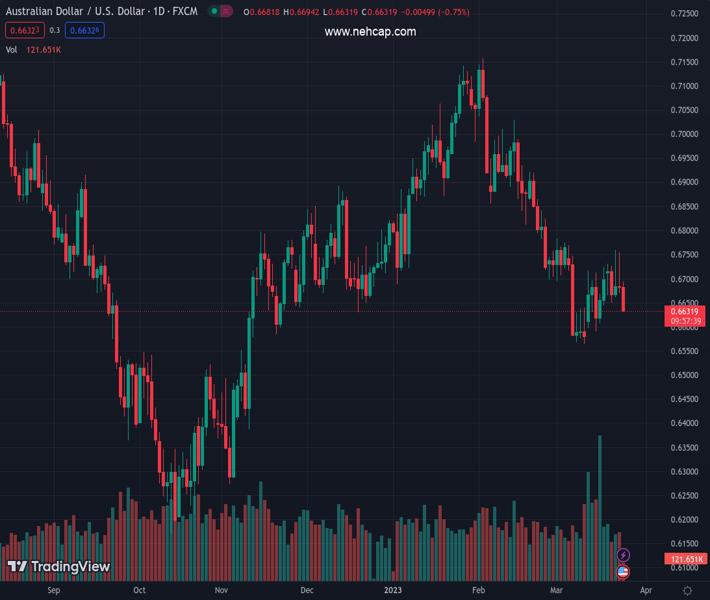
#AUDUSD @ 0.66336 comes under heavy selling pressure on Friday amid resurgent USD demand. (Pivot Orderbook analysis)
…
This is a premium post.
[s2If !current_user_can(access_s2member_level4)]Please register for PREMIUM VERSION HERE to read full post below containing analysis. In case of any error or you think you are not able to read the full post below, please email us at support#nehcap.com [lwa][/s2If] [s2If current_user_can(access_s2member_level4)]
- AUD/USD comes under heavy selling pressure on Friday amid resurgent USD demand.
- Reviving recession fears weigh on investors’ sentiment and boost the safe-haven buck.
- Traders now look to the US Durable Goods Orders and flash PMIs for a fresh impetus.
The pair currently trades last at 0.66336.
The previous day high was 0.6756 while the previous day low was 0.667. The daily 38.2% Fib levels comes at 0.6723, expected to provide resistance. Similarly, the daily 61.8% fib level is at 0.6703, expected to provide resistance.
The AUD/USD pair attracts fresh sellers on Friday and extends the previous day’s rejection slide from over a two-week peak, around the 0.6755-0.6760 region, which coincides with a technically significant 200-day Simple Moving Average (SMA). The intraday downfall drags spot prices to over a one-week high, around the 0.6635 area during the first half of the European session and is sponsored by resurgent US Dollar (USD) demand.
In fact, the USD Index, which tracks the Greenback against a basket of currencies, builds on the previous day’s solid bounce from a seven-week low and gains strong follow-through traction amid a sharp fall in the equity markets. The disappointing release of manufacturing PMIs from the Eurozone and the UK revived worries about looming recession risks. This, in turn, takes its toll on the global risk sentiment, which forces investors to take refuge in traditional safe-haven assets, including the Greenback.
This comes on the back of data released earlier this Friday, which indicated renewed contraction in Australia’s private sector business activity in February and drives flows away from the perceived riskier Aussie. In fact, the gauge for the manufacturing sector dropped to 48.7 in March from the 50.7 previous, while Services PMI came in at 48.2 during the reported month as compared to 50.7 in February. Furthermore, the Composite PMI also dropped to 48.1 in March from February’s 50.6 final print.
This, along with the Reserve Bank of Australia’s (RBA) dovish signal, indicating that a pause in the rate-hiking cycle may be on the cards next month, exerts additional downward pressure on the AUD/USD pair. It, however, remains to be seen if the USD bulls can maintain their dominant position amid the Fed’s less hawkish outlook on Wednesday. The US central bank raised interest rates by 25 bps, as expected, though sounded cautious about the outlook in the wake of the recent turmoil in the banking sector.
This leads to a further decline in the US Treasury bond yields and could act as a headwind for the Greenback, which should help limit losses for the AUD/USD pair, at least for the time being. Market participants now look forward to the US economic docket, featuring the release of Durable Goods Orders and flash PMI prints for March. This, along with the broader risk sentiment, will influence the USD price dynamics and allow traders to grab short-term opportunities around the pair heading into the weekend.
Technical Levels: Supports and Resistances
AUDUSD currently trading at 0.6641 at the time of writing. Pair opened at 0.6684 and is trading with a change of -0.64 % .
| Overview | Overview.1 | |
|---|---|---|
| 0 | Today last price | 0.6641 |
| 1 | Today Daily Change | -0.0043 |
| 2 | Today Daily Change % | -0.6400 |
| 3 | Today daily open | 0.6684 |
The pair remains strongly bearish on the daily time frame. It trades below the 20 SMA @ 0.668, 50 SMA 0.6852, 100 SMA @ 0.6791 and 200 SMA @ 0.6759.
| Trends | Trends.1 | |
|---|---|---|
| 0 | Daily SMA20 | 0.6680 |
| 1 | Daily SMA50 | 0.6852 |
| 2 | Daily SMA100 | 0.6791 |
| 3 | Daily SMA200 | 0.6759 |
The previous day high was 0.6756 while the previous day low was 0.667. The daily 38.2% Fib levels comes at 0.6723, expected to provide resistance. Similarly, the daily 61.8% fib level is at 0.6703, expected to provide resistance.
Note the levels of interest below:
- Pivot support is noted at 0.6651, 0.6617, 0.6565
- Pivot resistance is noted at 0.6736, 0.6789, 0.6822
| Levels | Levels.1 |
|---|---|
| Previous Daily High | 0.6756 |
| Previous Daily Low | 0.6670 |
| Previous Weekly High | 0.6725 |
| Previous Weekly Low | 0.6579 |
| Previous Monthly High | 0.7158 |
| Previous Monthly Low | 0.6698 |
| Daily Fibonacci 38.2% | 0.6723 |
| Daily Fibonacci 61.8% | 0.6703 |
| Daily Pivot Point S1 | 0.6651 |
| Daily Pivot Point S2 | 0.6617 |
| Daily Pivot Point S3 | 0.6565 |
| Daily Pivot Point R1 | 0.6736 |
| Daily Pivot Point R2 | 0.6789 |
| Daily Pivot Point R3 | 0.6822 |
[/s2If]
Join Our Telegram Group


