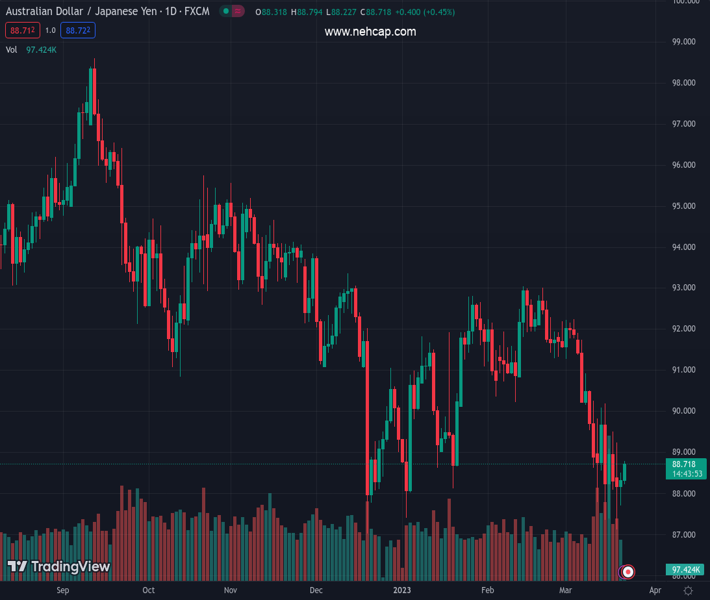
#AUDJPY @ 88.6690 has witnessed a decent rally after Japan Matsuno promised a more than two trillion Yen package. (Pivot Orderbook analysis)
…
This is a premium post.
[s2If !current_user_can(access_s2member_level4)]Please register for PREMIUM VERSION HERE to read full post below containing analysis. In case of any error or you think you are not able to read the full post below, please email us at support#nehcap.com [lwa][/s2If] [s2If current_user_can(access_s2member_level4)]
- AUD/JPY has witnessed a decent rally after Japan Matsuno promised a more than two trillion Yen package.
- The Australian Dollar is showing strength despite the RBA proposing a pause in the rate-hiking cycle from April.
- The cross has also delivered a breakout of the Symmetrical Triangle, which warrants a volatility expansion ahead.
The pair currently trades last at 88.6690.
The previous day high was 88.51 while the previous day low was 87.71. The daily 38.2% Fib levels comes at 88.2, expected to provide support. Similarly, the daily 61.8% fib level is at 88.02, expected to provide support.
The AUD/JPY pair has shown a decent upside in the early European session. The upside in the risk barometer is backed by the announcement of a relief package from Japanese Chief Cabinet Secretary Hirokazu Matsuno in which more than 2 trillion yen will be allocated for households to support them against rising prices.
Japanese administration and the Bank of Japan (BoJ) are focusing on the continuation of the expansionary policy to keep inflation near desired levels as a major contribution to the inflationary pressures is coming from higher import prices, not from the domestic forces.
The Australian Dollar is showing strength despite the Reserve Bank of Australia (RBA) having proposed a pause in the rate-hiking cycle from its April meeting. It seems that RBA policymakers are satisfied with a mere two-month of decline in Australian inflation.
AUD/JPY has climbed above the resistance-turned-support plotted from March 21 high at 88.48. The cross has also delivered a breakout of the Symmetrical Triangle chart pattern, which indicates a volatility expansion ahead.
The Australian Dollar would continue to find support from the 20-period Exponential Moving Average (EMA), which is hovering around 88.43.
Meanwhile, the Relative Strength Index (RSI) (14) is inch far from shifting into the bullish range of 60.00-80.00.
Investors would find an optimal buying opportunity near the 20-EMA around 88.43, which will drive the risk barometer towards March 20 high at 89.24 followed by the psychological resistance at 90.00.
In an alternate scenario, a south-side move below March 21 low at 87.71 would drag the cross toward March 20 low at 87.14. A break below the latter would expose the asset to a fresh annual low near 86.61, which is March 16 high.
Technical Levels: Supports and Resistances
AUDJPY currently trading at 88.67 at the time of writing. Pair opened at 88.36 and is trading with a change of 0.35 % .
| Overview | Overview.1 | |
|---|---|---|
| 0 | Today last price | 88.67 |
| 1 | Today Daily Change | 0.31 |
| 2 | Today Daily Change % | 0.35 |
| 3 | Today daily open | 88.36 |
The pair remains strongly bearish on the daily time frame. It trades below the 20 SMA @ 90.31, 50 SMA 90.92, 100 SMA @ 91.48 and 200 SMA @ 92.86.
| Trends | Trends.1 | |
|---|---|---|
| 0 | Daily SMA20 | 90.31 |
| 1 | Daily SMA50 | 90.92 |
| 2 | Daily SMA100 | 91.48 |
| 3 | Daily SMA200 | 92.86 |
The previous day high was 88.51 while the previous day low was 87.71. The daily 38.2% Fib levels comes at 88.2, expected to provide support. Similarly, the daily 61.8% fib level is at 88.02, expected to provide support.
Note the levels of interest below:
- Pivot support is noted at 87.88, 87.4, 87.09
- Pivot resistance is noted at 88.67, 88.99, 89.47
| Levels | Levels.1 |
|---|---|
| Previous Daily High | 88.51 |
| Previous Daily Low | 87.71 |
| Previous Weekly High | 90.20 |
| Previous Weekly Low | 87.36 |
| Previous Monthly High | 93.06 |
| Previous Monthly Low | 90.24 |
| Daily Fibonacci 38.2% | 88.20 |
| Daily Fibonacci 61.8% | 88.02 |
| Daily Pivot Point S1 | 87.88 |
| Daily Pivot Point S2 | 87.40 |
| Daily Pivot Point S3 | 87.09 |
| Daily Pivot Point R1 | 88.67 |
| Daily Pivot Point R2 | 88.99 |
| Daily Pivot Point R3 | 89.47 |
[/s2If]
Join Our Telegram Group


