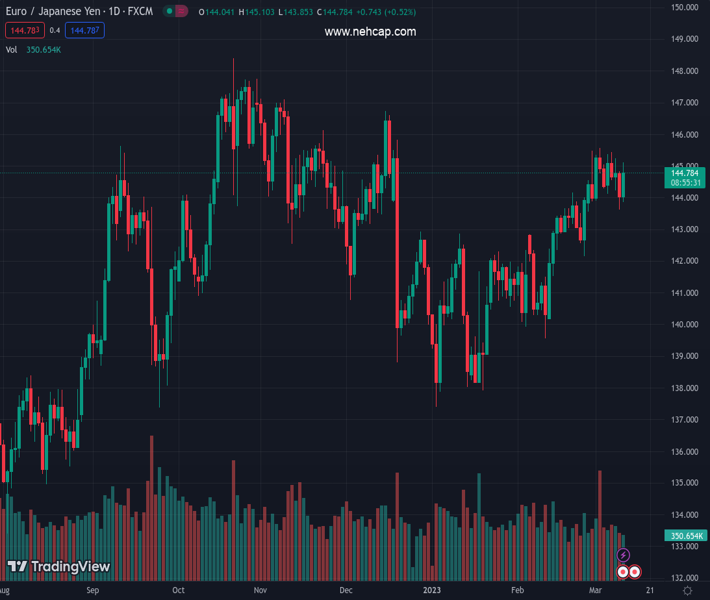
#EURJPY @ 144.825 reverses Thursday’s pullback and pokes with 145.00. (Pivot Orderbook analysis)
…
This is a premium post.
[s2If !current_user_can(access_s2member_level4)]Please register for PREMIUM VERSION HERE to read full post below containing analysis. In case of any error or you think you are not able to read the full post below, please email us at support#nehcap.com [lwa][/s2If] [s2If current_user_can(access_s2member_level4)]
- EUR/JPY reverses Thursday’s pullback and pokes with 145.00.
- Further gains could challenge the 2023 high at 145.56.
The pair currently trades last at 144.825.
The previous day high was 144.91 while the previous day low was 143.62. The daily 38.2% Fib levels comes at 144.11, expected to provide support. Similarly, the daily 61.8% fib level is at 144.42, expected to provide support.
EUR/JPY leaves behind Thursday’s marled retracement and briefly surpasses the 145.00 hurdle on Friday.
While further range bound trading seems likely for the time being, the cross is expected to accelerate its gains once the 2023 high at 145.56 (March 2) is cleared. Above this level comes the December 2022 top at 146.72 (December 15).
In the meantime, while above the 200-day SMA, today at 141.77, the outlook for the cross is expected to remain positive.
Technical Levels: Supports and Resistances
EURJPY currently trading at 144.84 at the time of writing. Pair opened at 144.0 and is trading with a change of 0.58 % .
| Overview | Overview.1 | |
|---|---|---|
| 0 | Today last price | 144.84 |
| 1 | Today Daily Change | 125.00 |
| 2 | Today Daily Change % | 0.58 |
| 3 | Today daily open | 144.00 |
The pair remains strongly bullish on the daily timeframe. It trades above its 20 SMA @ 143.67, 50 SMA 141.88, 100 SMA @ 143.13 and 200 SMA @ 141.79.
| Trends | Trends.1 | |
|---|---|---|
| 0 | Daily SMA20 | 143.67 |
| 1 | Daily SMA50 | 141.88 |
| 2 | Daily SMA100 | 143.13 |
| 3 | Daily SMA200 | 141.79 |
The previous day high was 144.91 while the previous day low was 143.62. The daily 38.2% Fib levels comes at 144.11, expected to provide support. Similarly, the daily 61.8% fib level is at 144.42, expected to provide support.
Note the levels of interest below:
- Pivot support is noted at 143.44, 142.89, 142.15
- Pivot resistance is noted at 144.73, 145.47, 146.02
| Levels | Levels.1 |
|---|---|
| Previous Daily High | 144.91 |
| Previous Daily Low | 143.62 |
| Previous Weekly High | 145.57 |
| Previous Weekly Low | 143.57 |
| Previous Monthly High | 145.47 |
| Previous Monthly Low | 139.55 |
| Daily Fibonacci 38.2% | 144.11 |
| Daily Fibonacci 61.8% | 144.42 |
| Daily Pivot Point S1 | 143.44 |
| Daily Pivot Point S2 | 142.89 |
| Daily Pivot Point S3 | 142.15 |
| Daily Pivot Point R1 | 144.73 |
| Daily Pivot Point R2 | 145.47 |
| Daily Pivot Point R3 | 146.02 |
[/s2If]
Join Our Telegram Group


