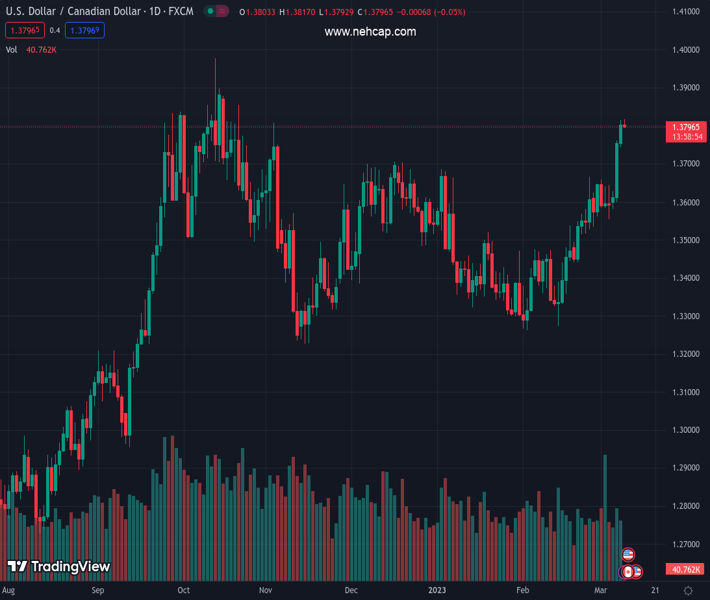
#USDCAD @ 1.37963 is seen consolidating its recent strong gains to the highest level since October. (Pivot Orderbook analysis)
…
This is a premium post.
[s2If !current_user_can(access_s2member_level4)]Please register for PREMIUM VERSION HERE to read full post below containing analysis. In case of any error or you think you are not able to read the full post below, please email us at support#nehcap.com [lwa][/s2If] [s2If current_user_can(access_s2member_level4)]
- USD/CAD is seen consolidating its recent strong gains to the highest level since October.
- A modest USD pullback from a multi-month top cap gains amid an uptick in Oil prices.
- The fundamental backdrop supports prospects for an extension of the bullish trajectory.
The pair currently trades last at 1.37963.
The previous day high was 1.3815 while the previous day low was 1.3745. The daily 38.2% Fib levels comes at 1.3788, expected to provide support. Similarly, the daily 61.8% fib level is at 1.3772, expected to provide support.
The USD/CAD pair enters a bullish consolidation phase and oscillates in a narrow trading band around the 1.3800 mark, just below its highest level since October touched earlier this Thursday.
The subdued price action comes on the back of a modest US Dollar pullback from over a three-month high. This, along with an uptick in Crude Oil prices underpin the commodity-linked Loonie and acts as a headwind for the USD/CAD pair. That said, the downside remains cushioned amid hawkish Fed expectations and worries about a deeper global economic downturn.
In fact, the markets have started pricing in a jumbo 50 bps lift-off at the upcoming FOMC meeting on March 21-22. The bets were lifted by Fed Chair Jerome Powell on Wednesday, reiterating that interest rates would have to go higher and possibly faster to tame stubbornly high inflation. This remains supportive of elevated US Treasury bond yields and favours the USD bulls.
Meanwhile, the prospects for further tightening the Fed add to worries about economic headwinds stemming from rapidly rising borrowing costs. This, along with fading optimism over a strong Chinese economic recovery, which could dent fuel demand, should keep a lid on Crude Oil prices, suggesting that the path of least resistance for the USD/CAD pair is to the upside.
The bullish outlook is reinforced by the fact that the Bank of Canada became the first major central bank to pause its rate-hiking cycle on Wednesday amid signs of easing inflationary pressure. The USD/CAD pair seems poised to aim to reclaim the 1.3900 mark and extend the positive momentum further towards the October 2022 swing high, around the 1.3975-1.3980 zone.
Traders now look to the US economic docket, featuring the release of Challenger Job Cuts and the usual Weekly Initial Jobless Claims data, due later during the early North American session. The focus, however, will remain on the monthly Canadian jobs data, which, along with the crucial US NFP report, should provide a fresh directional impetus to the USD/CAD pair.
Technical Levels: Supports and Resistances
USDCAD currently trading at 1.3797 at the time of writing. Pair opened at 1.3793 and is trading with a change of 0.03 % .
| Overview | Overview.1 | |
|---|---|---|
| 0 | Today last price | 1.3797 |
| 1 | Today Daily Change | 0.0004 |
| 2 | Today Daily Change % | 0.0300 |
| 3 | Today daily open | 1.3793 |
The pair remains strongly bullish on the daily timeframe. It trades above its 20 SMA @ 1.3533, 50 SMA 1.3468, 100 SMA @ 1.3501 and 200 SMA @ 1.33.
| Trends | Trends.1 | |
|---|---|---|
| 0 | Daily SMA20 | 1.3533 |
| 1 | Daily SMA50 | 1.3468 |
| 2 | Daily SMA100 | 1.3501 |
| 3 | Daily SMA200 | 1.3300 |
The previous day high was 1.3815 while the previous day low was 1.3745. The daily 38.2% Fib levels comes at 1.3788, expected to provide support. Similarly, the daily 61.8% fib level is at 1.3772, expected to provide support.
Note the levels of interest below:
- Pivot support is noted at 1.3754, 1.3715, 1.3684
- Pivot resistance is noted at 1.3823, 1.3854, 1.3893
| Levels | Levels.1 |
|---|---|
| Previous Daily High | 1.3815 |
| Previous Daily Low | 1.3745 |
| Previous Weekly High | 1.3659 |
| Previous Weekly Low | 1.3534 |
| Previous Monthly High | 1.3666 |
| Previous Monthly Low | 1.3262 |
| Daily Fibonacci 38.2% | 1.3788 |
| Daily Fibonacci 61.8% | 1.3772 |
| Daily Pivot Point S1 | 1.3754 |
| Daily Pivot Point S2 | 1.3715 |
| Daily Pivot Point S3 | 1.3684 |
| Daily Pivot Point R1 | 1.3823 |
| Daily Pivot Point R2 | 1.3854 |
| Daily Pivot Point R3 | 1.3893 |
[/s2If]
Join Our Telegram Group


