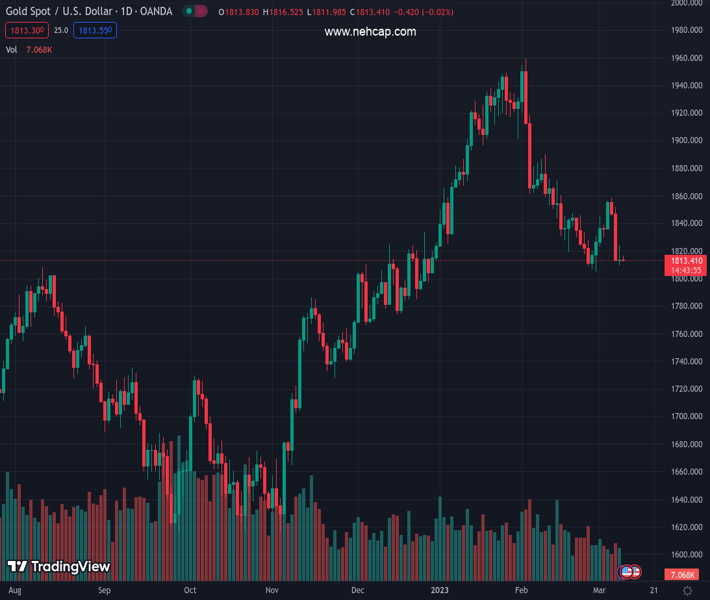
#XAUUSD @ 1,813.65 Gold price struggles to convince buyers inside a bearish chart formation., @nehcap view: Further downside expected (Pivot Orderbook analysis)
…
This is a premium post.
[s2If !current_user_can(access_s2member_level4)]Please register for PREMIUM VERSION HERE to read full post below containing analysis. In case of any error or you think you are not able to read the full post below, please email us at support#nehcap.com [lwa][/s2If] [s2If current_user_can(access_s2member_level4)]
- Gold price struggles to convince buyers inside a bearish chart formation.
- US Dollar Index traces two-year Treasury bond yields to retreat from multi-day high.
- Fears of higher US taxes, fading recovery hopes from China and hawkish Fed bets challenge XAU/USD bulls.
- Earlier signals for Friday’s US jobs report appear promising ahead of second-tier data.
The pair currently trades last at 1813.65.
The previous day high was 1824.33 while the previous day low was 1809.46. The daily 38.2% Fib levels comes at 1815.14, expected to provide resistance. Similarly, the daily 61.8% fib level is at 1818.65, expected to provide resistance.
Gold price (XAU/USD) remains indecisive around $1,813 during the initial hours of Thursday’s European session as traders seek more clues to defend the corrective bounce off a one-week low. Also challenging the metal’s immediate moves is a lack of major data/events, as well as a cautious mood ahead of Friday’s all-important US employment report for February.
The bullion bounced off a one-week low earlier in the day while cheering the US Dollar’s recent retreat amid the two-year Treasury bond yields’ pullback from the highest levels since 2007. That said, the US Dollar Index (DXY) snaps a two-day uptrend while easing from the highest levels since December 01, 2022, down 0.13% intraday near 105.55 by the press time, whereas the US two-year Treasury bond yields drop half a percent on a day to 5.05%
It should be noted that the hawkish comments from Fed Chair Jerome Powell, showing the readiness for further rate hikes if needed, join the optimistic prints of employment clues to challenge the XAU/USD’s latest rebound.
On the same line could be disappointment from China’s inflation data for February. Furthermore, the fears of higher taxes in the world’s biggest economy, the US, as well as the political chaos relating to it as US President Joe Biden proposes raising corporation tax from 21% to 28% in his latest budget guide ahead of Friday’s release, also challenge Gold buyers.
While portraying the mood, the S&P 500 Futures struggles for clear directions after bouncing off a one-week low the previous day. Further, the US 10-year Treasury bond yields rise to 3.99%, up one basis point (bp) on a day.
Looking ahead, US Initial Jobless Claims for the week ended on March 03 will join the Challenger Job Cuts for February to offer more details to predict Friday’s top-tier employment data, mainly the Nonfarm Payrolls (NFP) and can direct intraday XAU/USD moves.
Gold price portrays a “bear flag” on the hourly formation, suggesting the precious metal’s further downside on confirmation. Adding strength to the downside bias for the XAU/USD is the looming bear cross on the MACD and the latest retreat in RSI (14), not to forget the sustained trading below the 200-Hour Moving Average (HMA).
It’s worth noting, however, that the bullion needs to provide a clear break of the flag’s lower line, around $1,812 by the press time, to convince the XAU/USD sellers to aim for the $1,772 theoretical target.
During the fall, the $1,800 threshold and mid-December 2022 low near $1,775 may act as intermediate halts.
Alternatively, the aforementioned flag’s top line, close to $1,823 by the press time, guards the immediate upside of the Gold price ahead of the 200-HMA level of $1,830. Also acting as the upside hurdle is a downward-sloping resistance line from Monday, near $1,840 as we write.
Overall, Gold price is likely to remain weak but fresh selling awaits a clear break of $1,812.
Trend: Further downside expected
Technical Levels: Supports and Resistances
XAUUSD currently trading at 1813.43 at the time of writing. Pair opened at 1813.44 and is trading with a change of -0.00% % .
| Overview | Overview.1 | |
|---|---|---|
| 0 | Today last price | 1813.43 |
| 1 | Today Daily Change | -0.01 |
| 2 | Today Daily Change % | -0.00% |
| 3 | Today daily open | 1813.44 |
The pair is trading below its 20 Daily moving average @ 1836.7, below its 50 Daily moving average @ 1869.82 , above its 100 Daily moving average @ 1806.3 and above its 200 Daily moving average @ 1775.16
| Trends | Trends.1 | |
|---|---|---|
| 0 | Daily SMA20 | 1836.70 |
| 1 | Daily SMA50 | 1869.82 |
| 2 | Daily SMA100 | 1806.30 |
| 3 | Daily SMA200 | 1775.16 |
The previous day high was 1824.33 while the previous day low was 1809.46. The daily 38.2% Fib levels comes at 1815.14, expected to provide resistance. Similarly, the daily 61.8% fib level is at 1818.65, expected to provide resistance.
Note the levels of interest below:
- Pivot support is noted at 1807.16, 1800.87, 1792.29
- Pivot resistance is noted at 1822.03, 1830.61, 1836.9
| Levels | Levels.1 |
|---|---|
| Previous Daily High | 1824.33 |
| Previous Daily Low | 1809.46 |
| Previous Weekly High | 1856.35 |
| Previous Weekly Low | 1804.76 |
| Previous Monthly High | 1959.80 |
| Previous Monthly Low | 1804.76 |
| Daily Fibonacci 38.2% | 1815.14 |
| Daily Fibonacci 61.8% | 1818.65 |
| Daily Pivot Point S1 | 1807.16 |
| Daily Pivot Point S2 | 1800.87 |
| Daily Pivot Point S3 | 1792.29 |
| Daily Pivot Point R1 | 1822.03 |
| Daily Pivot Point R2 | 1830.61 |
| Daily Pivot Point R3 | 1836.90 |
[/s2If]
Join Our Telegram Group


