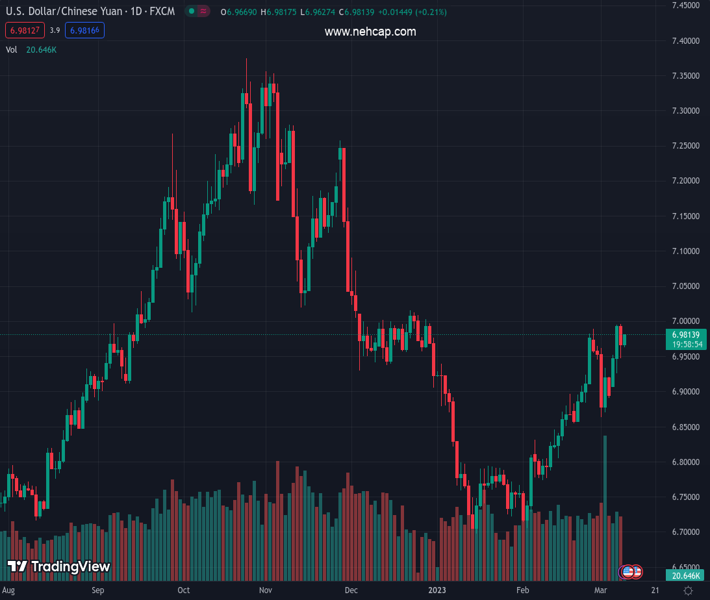
#USDCNH @ 6.98123 has scaled above 6.9750 as the Chinese economy has registered a deflation by 0.5%. (Pivot Orderbook analysis)
…
This is a premium post.
[s2If !current_user_can(access_s2member_level4)]Please register for PREMIUM VERSION HERE to read full post below containing analysis. In case of any error or you think you are not able to read the full post below, please email us at support#nehcap.com [lwa][/s2If] [s2If current_user_can(access_s2member_level4)]
- USD/CNH has scaled above 6.9750 as the Chinese economy has registered a deflation by 0.5%.
- Producers have lowered prices of goods and services at factory gates due to sluggish demand.
- Upbeat US ADP Employment data has confirmed that January’s strong data was not a one-time blip.
The pair currently trades last at 6.98123.
The previous day high was 6.997 while the previous day low was 6.947. The daily 38.2% Fib levels comes at 6.9662, expected to provide support. Similarly, the daily 61.8% fib level is at 6.978, expected to provide support.
The USD/CNH pair has jumped above 6.9750 as China’s National Bureau of Statistics (NBS) has reported a sense of deflation in the Consumer Price Index (CPI) (Feb) data. Monthly CPI figures have contracted by 0.5% while the street was anticipating a decline to 0.2% from the former release of 0.8%. The prices of goods and services in China have accelerated by 1% annually, lower than the consensus of 1.9% and the prior release of 2.1%.
Apart from that, the annual Producer Price Index (PPI) has contracted by 1.4% vs. the consensus of 1.3% contraction and 0.8% contraction in the prior release. This indicates that producers lowered the prices of goods and services at factory gates. The reason behind lowering prices could be sluggish demand. It seems that China’s reopening has failed to propel domestic demand.
A sense of deflation might force the People’s Bank of China (PBoC) and the Chinese administration to inject helicopter money into the economy to support the overall demand.
The US Dollar Index (DXY) is gathering strength as United States President Joe Biden has proposed an increase in corporation taxes from 21% to 28%. US Biden wants a 25% billionaire tax and large levies on rich investors. He has also proposed a tax on income over $400,000 at 39.6% in the budget.
More taxes on US individuals will be considered as contracting Fiscal policy, which might support the Federal Reserve (Fed) in bringing down the stubborn inflation.
Fed chair Jerome Powell has confirmed a higher terminal rate than previously anticipated as the battle against sticky inflation is getting complicated. Also, upbeat US Automatic Data Processing (ADP) Employment data has confirmed that January’s strong data on the labor market and consumer spending was not a one-time blip.
Technical Levels: Supports and Resistances
USDCNH currently trading at 6.9748 at the time of writing. Pair opened at 6.9676 and is trading with a change of 0.1 % .
| Overview | Overview.1 | |
|---|---|---|
| 0 | Today last price | 6.9748 |
| 1 | Today Daily Change | 0.0072 |
| 2 | Today Daily Change % | 0.1000 |
| 3 | Today daily open | 6.9676 |
The pair is trading above its 20 Daily moving average @ 6.8982, above its 50 Daily moving average @ 6.8388 , below its 100 Daily moving average @ 6.9772 and above its 200 Daily moving average @ 6.9206
| Trends | Trends.1 | |
|---|---|---|
| 0 | Daily SMA20 | 6.8982 |
| 1 | Daily SMA50 | 6.8388 |
| 2 | Daily SMA100 | 6.9772 |
| 3 | Daily SMA200 | 6.9206 |
The previous day high was 6.997 while the previous day low was 6.947. The daily 38.2% Fib levels comes at 6.9662, expected to provide support. Similarly, the daily 61.8% fib level is at 6.978, expected to provide support.
Note the levels of interest below:
- Pivot support is noted at 6.944, 6.9206, 6.894
- Pivot resistance is noted at 6.994, 7.0205, 7.044
| Levels | Levels.1 |
|---|---|
| Previous Daily High | 6.9970 |
| Previous Daily Low | 6.9470 |
| Previous Weekly High | 6.9898 |
| Previous Weekly Low | 6.8634 |
| Previous Monthly High | 6.9898 |
| Previous Monthly Low | 6.7056 |
| Daily Fibonacci 38.2% | 6.9662 |
| Daily Fibonacci 61.8% | 6.9780 |
| Daily Pivot Point S1 | 6.9440 |
| Daily Pivot Point S2 | 6.9206 |
| Daily Pivot Point S3 | 6.8940 |
| Daily Pivot Point R1 | 6.9940 |
| Daily Pivot Point R2 | 7.0205 |
| Daily Pivot Point R3 | 7.0440 |
[/s2If]
Join Our Telegram Group


