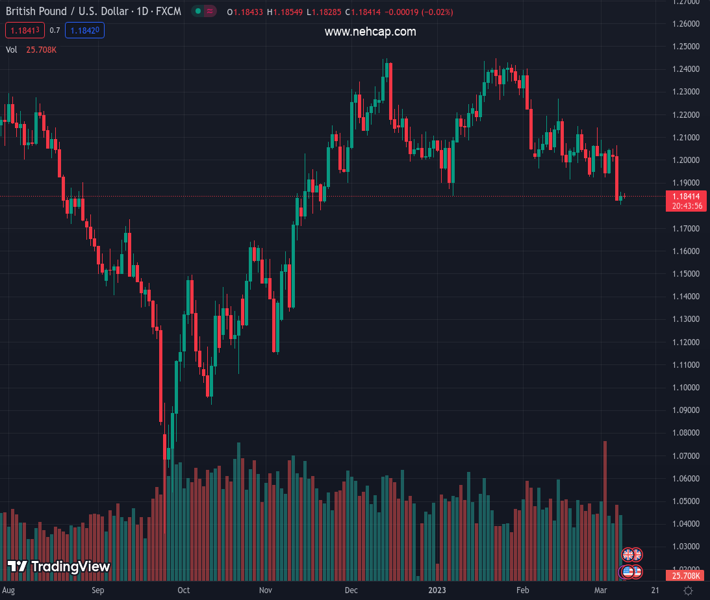
#GBPUSD @ 1.18429 retreats from intraday high, fades bounce off the lowest levels since late November 2022., @nehcap view: Bearish (Pivot Orderbook analysis)
…
This is a premium post.
[s2If !current_user_can(access_s2member_level4)]Please register for PREMIUM VERSION HERE to read full post below containing analysis. In case of any error or you think you are not able to read the full post below, please email us at support#nehcap.com [lwa][/s2If] [s2If current_user_can(access_s2member_level4)]
- GBP/USD retreats from intraday high, fades bounce off the lowest levels since late November 2022.
- Bearish MACD signals, sustained trading below the key support line and 200-DMA favor sllers.
- Buyers lack conviction below 1.2150, one-month-old descending trend line adds to the upside filter.
The pair currently trades last at 1.18429.
The previous day high was 1.186 while the previous day low was 1.1803. The daily 38.2% Fib levels comes at 1.1838, expected to provide support. Similarly, the daily 61.8% fib level is at 1.1824, expected to provide support.
GBP/USD struggles to extend the previous day’s corrective bounce off the lowest levels since November 21, 2022, making rounds to 1.1850 on Thursday morning in Asia.
In doing so, the Cable pair fails to justify the previous day’s bullish candlestick on the daily chart, namely the bullish spinning top.
The reason could be linked to the pair’s sustained downside break of a 15-week-old ascending trend line, previous support near 1.1935, as well as the 200-DMA breakdown. Also adding strength to the downside bias are the bearish MACD signals.
That said, the GBP/USD quote’s fresh weakness could aim for the 50% Fibonacci retracement level of November 2022 to January 2023 upside, near 1.1800.
Following that, a slump toward the 61.8% Fibonacci retracement level surrounding 1.1645, also known as the golden ratio, can’t be ruled out.
Meanwhile, the 200-DMA hurdle of around 1.1900 restricts immediate GBP/USD recovery before highlighting the support-turned-resistance line close to 1.1935.
Even if the Cable pair crosses the 1.1935 hurdle, a downward-sloping resistance line from early February, near 1.2055 could act as the last defense of the GBP/USD bears.
To sum up, GBP/USD remains on the bear’s radar despite the latest rebound, as well as posting the bullish candlestick.
Trend: Bearish
Technical Levels: Supports and Resistances
GBPUSD currently trading at 1.1845 at the time of writing. Pair opened at 1.1849 and is trading with a change of -0.03% % .
| Overview | Overview.1 | |
|---|---|---|
| 0 | Today last price | 1.1845 |
| 1 | Today Daily Change | -0.0004 |
| 2 | Today Daily Change % | -0.03% |
| 3 | Today daily open | 1.1849 |
The pair remains strongly bearish on the daily time frame. It trades below the 20 SMA @ 1.2025, 50 SMA 1.2133, 100 SMA @ 1.2003 and 200 SMA @ 1.1906.
| Trends | Trends.1 | |
|---|---|---|
| 0 | Daily SMA20 | 1.2025 |
| 1 | Daily SMA50 | 1.2133 |
| 2 | Daily SMA100 | 1.2003 |
| 3 | Daily SMA200 | 1.1906 |
The previous day high was 1.186 while the previous day low was 1.1803. The daily 38.2% Fib levels comes at 1.1838, expected to provide support. Similarly, the daily 61.8% fib level is at 1.1824, expected to provide support.
Note the levels of interest below:
- Pivot support is noted at 1.1814, 1.178, 1.1758
- Pivot resistance is noted at 1.1871, 1.1894, 1.1928
| Levels | Levels.1 |
|---|---|
| Previous Daily High | 1.1860 |
| Previous Daily Low | 1.1803 |
| Previous Weekly High | 1.2143 |
| Previous Weekly Low | 1.1922 |
| Previous Monthly High | 1.2402 |
| Previous Monthly Low | 1.1915 |
| Daily Fibonacci 38.2% | 1.1838 |
| Daily Fibonacci 61.8% | 1.1824 |
| Daily Pivot Point S1 | 1.1814 |
| Daily Pivot Point S2 | 1.1780 |
| Daily Pivot Point S3 | 1.1758 |
| Daily Pivot Point R1 | 1.1871 |
| Daily Pivot Point R2 | 1.1894 |
| Daily Pivot Point R3 | 1.1928 |
[/s2If]
Join Our Telegram Group


