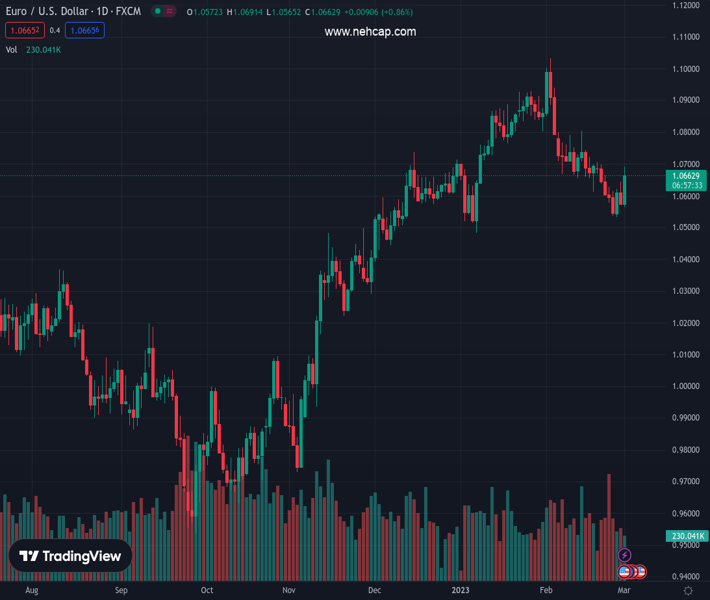
#EURUSD @ 1.06704 rose sharply and pokes with the key 1.0700 hurdle. (Pivot Orderbook analysis)
…
This is a premium post.
[s2If !current_user_can(access_s2member_level4)]Please register for PREMIUM VERSION HERE to read full post below containing analysis. In case of any error or you think you are not able to read the full post below, please email us at support#nehcap.com [lwa][/s2If] [s2If current_user_can(access_s2member_level4)]
- EUR/USD rose sharply and pokes with the key 1.0700 hurdle.
- The surpass of 1.0804 opens the door to extra advances.
The pair currently trades last at 1.06704.
The previous day high was 1.0646 while the previous day low was 1.0577. The daily 38.2% Fib levels comes at 1.0603, expected to provide support. Similarly, the daily 61.8% fib level is at 1.0619, expected to provide support.
EUR/USD strongly reverses Tuesday’s decline and trades at shouting distance from the 1.0700 barrier on Wednesday.
There is a temporary up barrier at the 55-day SMA at 1.0715 prior to the weekly high at 1.0804 (February 14). A convincing move above the latter could open the door to extra gains in the short-term horizon with the immediate target at the 2023 peak at 1.1032 (February 2).
Looking at the longer run, the constructive view remains unchanged while above the 200-day SMA, today at 1.0328.
Technical Levels: Supports and Resistances
EURUSD currently trading at 1.0672 at the time of writing. Pair opened at 1.0577 and is trading with a change of 0.9 % .
| Overview | Overview.1 | |
|---|---|---|
| 0 | Today last price | 1.0672 |
| 1 | Today Daily Change | 126.0000 |
| 2 | Today Daily Change % | 0.9000 |
| 3 | Today daily open | 1.0577 |
The pair is trading below its 20 Daily moving average @ 1.0703, below its 50 Daily moving average @ 1.0725 , above its 100 Daily moving average @ 1.0469 and above its 200 Daily moving average @ 1.033
| Trends | Trends.1 | |
|---|---|---|
| 0 | Daily SMA20 | 1.0703 |
| 1 | Daily SMA50 | 1.0725 |
| 2 | Daily SMA100 | 1.0469 |
| 3 | Daily SMA200 | 1.0330 |
The previous day high was 1.0646 while the previous day low was 1.0577. The daily 38.2% Fib levels comes at 1.0603, expected to provide support. Similarly, the daily 61.8% fib level is at 1.0619, expected to provide support.
Note the levels of interest below:
- Pivot support is noted at 1.0554, 1.0531, 1.0485
- Pivot resistance is noted at 1.0623, 1.0668, 1.0691
| Levels | Levels.1 |
|---|---|
| Previous Daily High | 1.0646 |
| Previous Daily Low | 1.0577 |
| Previous Weekly High | 1.0705 |
| Previous Weekly Low | 1.0536 |
| Previous Monthly High | 1.1033 |
| Previous Monthly Low | 1.0533 |
| Daily Fibonacci 38.2% | 1.0603 |
| Daily Fibonacci 61.8% | 1.0619 |
| Daily Pivot Point S1 | 1.0554 |
| Daily Pivot Point S2 | 1.0531 |
| Daily Pivot Point S3 | 1.0485 |
| Daily Pivot Point R1 | 1.0623 |
| Daily Pivot Point R2 | 1.0668 |
| Daily Pivot Point R3 | 1.0691 |
[/s2If]
Join Our Telegram Group


