#XAUUSD @ 1,825.85 Gold price retreats from the highest levels in one week, renews intraday low of late., @nehcap view: Limited downside expected (Pivot Orderbook analysis)
…
This is a premium post.
[s2If !current_user_can(access_s2member_level4)]Please register for PREMIUM VERSION HERE to read full post below containing analysis. In case of any error or you think you are not able to read the full post below, please email us at support#nehcap.com [lwa][/s2If] [s2If current_user_can(access_s2member_level4)]
- Gold price retreats from the highest levels in one week, renews intraday low of late.
- Firmer United States Treasury bond yields underpin US Dollar strength and weigh on XAU/USD price.
- Hawkish Fed concerns, inflation fears keep Gold bears hopeful as the key March month begins.
- US ISM Manufacturing, Services PMI will direct immediate XAU/USD moves.
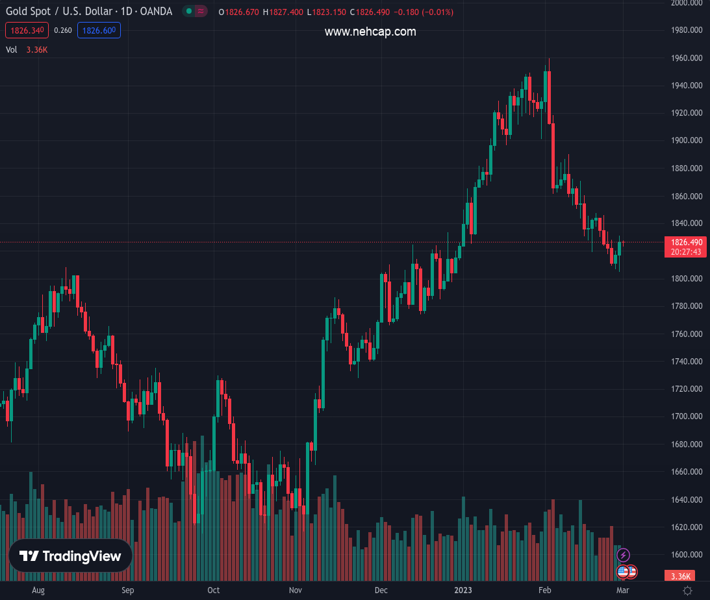
The pair currently trades last at 1825.85.
The previous day high was 1831.23 while the previous day low was 1804.76. The daily 38.2% Fib levels comes at 1821.12, expected to provide support. Similarly, the daily 61.8% fib level is at 1814.87, expected to provide support.
Gold price (XAU/USD) takes offers to refresh intraday low around $1,823 while paring the weekly gains amid early Wednesday. In doing so, the bright metal bears the burden of the firmer United States Treasury bond yields, as well as the US Dollar, while paying little heed to the recently downbeat US data. The XAU/USD retreat could be linked to the hopes of worsening inflation woes and higher interest rates, as well as fears emanating from China.
Gold price returns to the bear’s table, after an absence for two days, as the United States Treasury bond yields keep portraying the market’s fears of inflation and higher rates. That said, the benchmark 10-year Treasury bond yields rise three basis points (bps) to 3.94% while the two-year counterpart rises four bps to 4.84% by the press time. It’s worth noting that both these key bond coupons gained the most since September 2022 during the last month.
It’s worth noting that the higher inflation woes could be linked to the sustained geopolitical tension between Ukraine and Russia, as well as fears of more supply-chain issues emanating from the UK and China. Adding strength to the fears of more costs could be the late effects of previously announced easy money policies and government stimulus to defend the respective economies from Covid, as well as the geopolitical woes.
That said, Federal Reserve (Fed) officials appear the most hawkish on interest rates after witnessing the latest bout of strong US data while the other key central bankers, namely from the European Central Bank (ECB) and Bank of England (BoE), also vouch for the higher rates.
While the yields are up, the US Dollar Index (DXY) also begins March month on the positive side after snapping the four-month downtrend in February. That said, the DXY renews intraday high above 105.00 by the press time.
Apart from the strong United States Treasury bond yields and the US Dollar, anxiety ahead of the key testimony from Federal Reserve (Fed) Chairman Jerome Powell and the Federal Open Market Committee (FOMC) monetary policy meeting also weighs on the sentiment and the Gold price. It should be noted that the recent headlines from Bloomberg suggesting a big overhaul of Chinese government agencies and a likely increase in the US-China tension seem to add to the market’s risk-off mood and please the XAU/USD sellers. While portraying the mood, S&P 500 Futures track Wall Street’s mild losses, down 0.47% intraday near 3,960.
It’s worth noting that Tuesday’s downbeat prints of the second-tier US data failed to lure the Gold buyers amid a broad risk-off mood and the firmer US Dollar. That said, the US Conference Board’s (CB) Consumer Confidence dropped for the second consecutive month to 102.9 versus 106.0 prior (revised) while US Housing Price Index drops 0.1% in December versus -0.6% market forecasts and -0.1% prior. On the same line, the S&P/Case-Shiller Home Price Indices grew 4.6% YoY during the said month compared to 6.1% market expectations and 6.8% previous readings. Furthermore, Chicago Purchasing Managers’ Index for February eased to 43.6 from 44.3 previous readings and 45.0 market consensus. Additionally, the Richmond Fed Manufacturing Index for the said month eased below 11.0 prior and -5.0 expected to -16 for the said month.
Moving on, Caixin Manufacturing PMI for February precedes the US ISM Manufacturing PMI for the said month to direct intraday moves of the Gold price. However, major attention should be given to the risk catalysts for clear directions.
The Gold price marks another pullback from the 50-bar Simple Moving Average (SMA), retreating towards the two-week-old resistance-turned-support near $1,819 by the press time.
Even so, the metal’s sustained break of the immediate resistance line joins the bullish signals from the Moving Average Convergence and Divergence (MACD) indicator to keep Gold buyers hopeful. Adding strength to the upside bias for the XAU/USD could be the upbeat Relative Strength Index (RSI) line placed at 14.
It’s worth noting that the recent low surrounding $1,805 and a downward-sloping support line from early February, close to $1,785 by the press time, could lure the XAU/USD bears past $1,819.
Alternatively, an upside break of the 50-SMA level surrounding $1,819 needs validation from multiple tops marked during February around $1,848, $1,870 and $1,890.
Trend: Limited downside expected
Technical Levels: Supports and Resistances
XAUUSD currently trading at 1824.92 at the time of writing. Pair opened at 1826.57 and is trading with a change of -0.09% % .
| Overview | Overview.1 | |
|---|---|---|
| 0 | Today last price | 1824.92 |
| 1 | Today Daily Change | -1.65 |
| 2 | Today Daily Change % | -0.09% |
| 3 | Today daily open | 1826.57 |
The pair is trading below its 20 Daily moving average @ 1853.82, below its 50 Daily moving average @ 1866.14 , above its 100 Daily moving average @ 1795.44 and above its 200 Daily moving average @ 1775.63
| Trends | Trends.1 | |
|---|---|---|
| 0 | Daily SMA20 | 1853.82 |
| 1 | Daily SMA50 | 1866.14 |
| 2 | Daily SMA100 | 1795.44 |
| 3 | Daily SMA200 | 1775.63 |
The previous day high was 1831.23 while the previous day low was 1804.76. The daily 38.2% Fib levels comes at 1821.12, expected to provide support. Similarly, the daily 61.8% fib level is at 1814.87, expected to provide support.
Note the levels of interest below:
- Pivot support is noted at 1810.48, 1794.38, 1784.01
- Pivot resistance is noted at 1836.95, 1847.32, 1863.42
| Levels | Levels.1 |
|---|---|
| Previous Daily High | 1831.23 |
| Previous Daily Low | 1804.76 |
| Previous Weekly High | 1847.59 |
| Previous Weekly Low | 1808.99 |
| Previous Monthly High | 1959.80 |
| Previous Monthly Low | 1804.76 |
| Daily Fibonacci 38.2% | 1821.12 |
| Daily Fibonacci 61.8% | 1814.87 |
| Daily Pivot Point S1 | 1810.48 |
| Daily Pivot Point S2 | 1794.38 |
| Daily Pivot Point S3 | 1784.01 |
| Daily Pivot Point R1 | 1836.95 |
| Daily Pivot Point R2 | 1847.32 |
| Daily Pivot Point R3 | 1863.42 |
[/s2If]
Join Our Telegram Group


