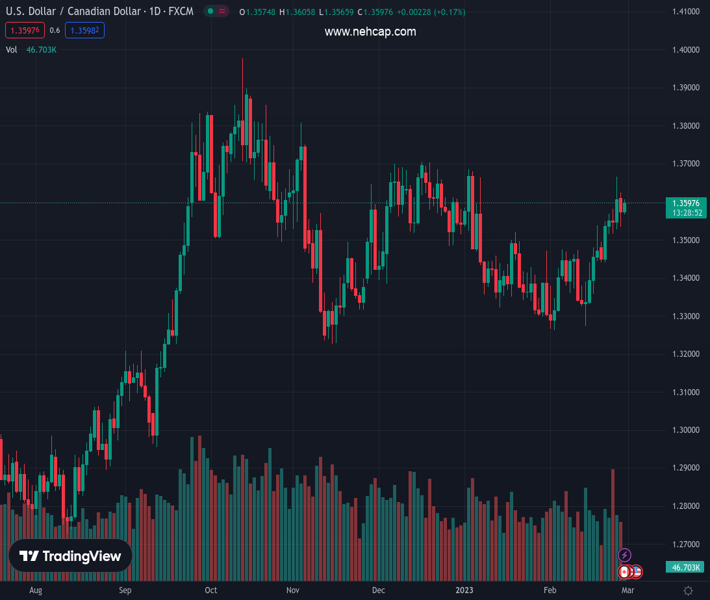
#USDCAD @ 1.35958 regains positive traction on Tuesday amid the emergence of fresh USD buying. (Pivot Orderbook analysis)
…
This is a premium post.
[s2If !current_user_can(access_s2member_level4)]Please register for PREMIUM VERSION HERE to read full post below containing analysis. In case of any error or you think you are not able to read the full post below, please email us at support#nehcap.com [lwa][/s2If] [s2If current_user_can(access_s2member_level4)]
- USD/CAD regains positive traction on Tuesday amid the emergence of fresh USD buying.
- Hawkish Fed expectations, elevated US bond yields and recession fears benefit the buck.
- A pickup in Oil prices does little to underpin the Loonie and hinder the intraday move up.
The pair currently trades last at 1.35958.
The previous day high was 1.3624 while the previous day low was 1.3534. The daily 38.2% Fib levels comes at 1.3569, expected to provide support. Similarly, the daily 61.8% fib level is at 1.359, expected to provide support.
The USD/CAD pair catches fresh bids on Tuesday and builds on its intraday positive move through the early European session. The momentum lifts spot prices back above the 1.3600 mark in the last hour and is sponsored by renewed US Dollar buying interest.
Following a brief pause on Monday, the USD is back in demand and remains pinned near a seven-month high amid the prospects for further policy tightening by the Federal Reserve. The markets now seem convinced that the US central bank will have to raise rates more than initially expected to tame stubbornly high inflation. The bets were lifted by the US PCE Price Index released last Friday, which indicated that inflation isn’t coming down quite as fast as hoped.
Moreover, the incoming positive US macro data point to an economy that remains resilient despite rising borrowing costs and should allow the Fed to stick to its hawkish stance for longer. This, in turn, triggers a resh leg up in the US Treasury bond yields and continues to lend support to the USD. Apart from this, a generally weaker risk tone – amid looming recession risks and geopolitical tensions – benefits the Greenback’s relative safe-haven status.
The USD/CAD bulls, meanwhile, seem unaffected by a goodish pickup in Crude Oil prices, which tend to underpin the commodity-linked Loonie. This, in turn, suggests that the path of least resistance for the pair is to the upside. Traders now look forward to the release of the monthly Canadian GDP, due later during the early North American session. The US economic docket features the Conference Board’s US Consumer Confidence Index and regional manufacturing PMIs.
This, along with the US bond yields and the broader risk sentiment, will drive demand for the buck. Apart from this, Oil price dynamics should provide some impetus to the USD/CAD pair and help traders to grab short-term opportunities.
Technical Levels: Supports and Resistances
USDCAD currently trading at 1.3598 at the time of writing. Pair opened at 1.3576 and is trading with a change of 0.16 % .
| Overview | Overview.1 | |
|---|---|---|
| 0 | Today last price | 1.3598 |
| 1 | Today Daily Change | 0.0022 |
| 2 | Today Daily Change % | 0.1600 |
| 3 | Today daily open | 1.3576 |
The pair remains strongly bullish on the daily timeframe. It trades above its 20 SMA @ 1.3434, 50 SMA 1.346, 100 SMA @ 1.351 and 200 SMA @ 1.3268.
| Trends | Trends.1 | |
|---|---|---|
| 0 | Daily SMA20 | 1.3434 |
| 1 | Daily SMA50 | 1.3460 |
| 2 | Daily SMA100 | 1.3510 |
| 3 | Daily SMA200 | 1.3268 |
The previous day high was 1.3624 while the previous day low was 1.3534. The daily 38.2% Fib levels comes at 1.3569, expected to provide support. Similarly, the daily 61.8% fib level is at 1.359, expected to provide support.
Note the levels of interest below:
- Pivot support is noted at 1.3531, 1.3487, 1.3441
- Pivot resistance is noted at 1.3622, 1.3669, 1.3713
| Levels | Levels.1 |
|---|---|
| Previous Daily High | 1.3624 |
| Previous Daily Low | 1.3534 |
| Previous Weekly High | 1.3666 |
| Previous Weekly Low | 1.3441 |
| Previous Monthly High | 1.3685 |
| Previous Monthly Low | 1.3300 |
| Daily Fibonacci 38.2% | 1.3569 |
| Daily Fibonacci 61.8% | 1.3590 |
| Daily Pivot Point S1 | 1.3531 |
| Daily Pivot Point S2 | 1.3487 |
| Daily Pivot Point S3 | 1.3441 |
| Daily Pivot Point R1 | 1.3622 |
| Daily Pivot Point R2 | 1.3669 |
| Daily Pivot Point R3 | 1.3713 |
[/s2If]
Join Our Telegram Group


