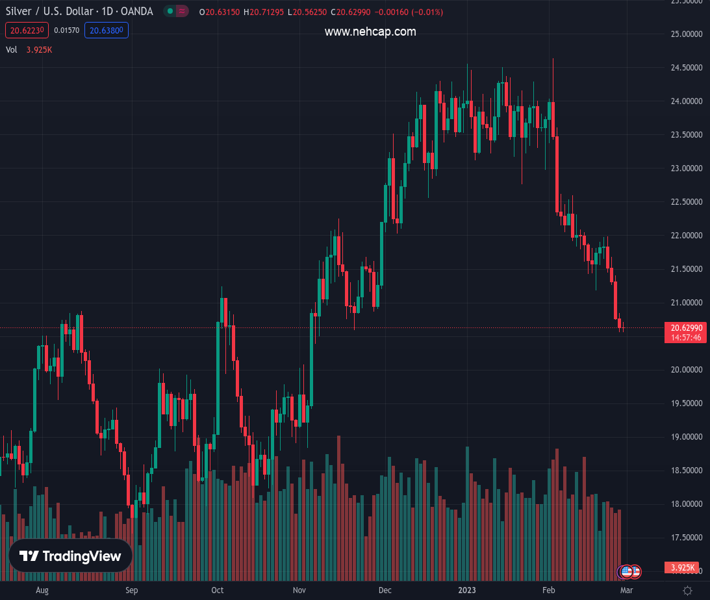
#XAGUSD @ 20.628 Silver price snaps four-day downtrend while bouncing off the lowest levels since early November 2022., @nehcap view: Bearish (Pivot Orderbook analysis)
…
This is a premium post.
[s2If !current_user_can(access_s2member_level4)]Please register for PREMIUM VERSION HERE to read full post below containing analysis. In case of any error or you think you are not able to read the full post below, please email us at support#nehcap.com [lwa][/s2If] [s2If current_user_can(access_s2member_level4)]
- Silver price snaps four-day downtrend while bouncing off the lowest levels since early November 2022.
- Bearish MACD signals, sustained trading below 200-DMA keep sellers hopeful.
- Multiple hurdles stand tall to challenge XAG/USD buyers.
The pair currently trades last at 20.628.
The previous day high was 20.84 while the previous day low was 20.56. The daily 38.2% Fib levels comes at 20.67, expected to provide resistance. Similarly, the daily 61.8% fib level is at 20.74, expected to provide resistance.
Silver price (XAG/USD) clings to mild gains around $20.70 as bulls struggle to defend the first daily gains in five during early Tuesday.
That said, the bright metal dropped to the lowest levels since November 2022 before bouncing off $20.56. The metal’s recovery could be linked to a U-turn from the three-month-old horizontal support.
Despite the latest rebound, the XAG/USD remains on the seller’s radar as it stays below the 200-DMA amid bearish MACD signals.
Even if the precious metal crosses the 200-DMA hurdle of $21.00, a downward-sloping resistance line from February 02, close to $21.25 by the press time, could challenge the Silver buyers afterward.
It’s worth observing that the XAG/USD bears remain hopeful unless the quote stays below the $22.00-10 resistance area comprising multiple tops marked since the last November.
On the contrary, a daily closing below the aforementioned three-month-old horizontal support near $20.50 will challenge an ascending support line from early September 2022, around $20.25 to please the Silver bears.
It should be noted that the $20.00 psychological magnet acts as an extra filter toward the south.
Overall, the Silver price remains weak unless breaking the $22.10 hurdle. The downside moves, however, appear to have limited room towards the south.
Trend: Bearish
Technical Levels: Supports and Resistances
XAGUSD currently trading at 20.67 at the time of writing. Pair opened at 20.59 and is trading with a change of 0.39% % .
| Overview | Overview.1 | |
|---|---|---|
| 0 | Today last price | 20.67 |
| 1 | Today Daily Change | 0.08 |
| 2 | Today Daily Change % | 0.39% |
| 3 | Today daily open | 20.59 |
The pair remains strongly bearish on the daily time frame. It trades below the 20 SMA @ 22.05, 50 SMA 23.09, 100 SMA @ 22.03 and 200 SMA @ 21.0.
| Trends | Trends.1 | |
|---|---|---|
| 0 | Daily SMA20 | 22.05 |
| 1 | Daily SMA50 | 23.09 |
| 2 | Daily SMA100 | 22.03 |
| 3 | Daily SMA200 | 21.00 |
The previous day high was 20.84 while the previous day low was 20.56. The daily 38.2% Fib levels comes at 20.67, expected to provide resistance. Similarly, the daily 61.8% fib level is at 20.74, expected to provide resistance.
Note the levels of interest below:
- Pivot support is noted at 20.48, 20.38, 20.2
- Pivot resistance is noted at 20.77, 20.95, 21.05
| Levels | Levels.1 |
|---|---|
| Previous Daily High | 20.84 |
| Previous Daily Low | 20.56 |
| Previous Weekly High | 21.98 |
| Previous Weekly Low | 20.74 |
| Previous Monthly High | 24.55 |
| Previous Monthly Low | 22.76 |
| Daily Fibonacci 38.2% | 20.67 |
| Daily Fibonacci 61.8% | 20.74 |
| Daily Pivot Point S1 | 20.48 |
| Daily Pivot Point S2 | 20.38 |
| Daily Pivot Point S3 | 20.20 |
| Daily Pivot Point R1 | 20.77 |
| Daily Pivot Point R2 | 20.95 |
| Daily Pivot Point R3 | 21.05 |
[/s2If]
Join Our Telegram Group


