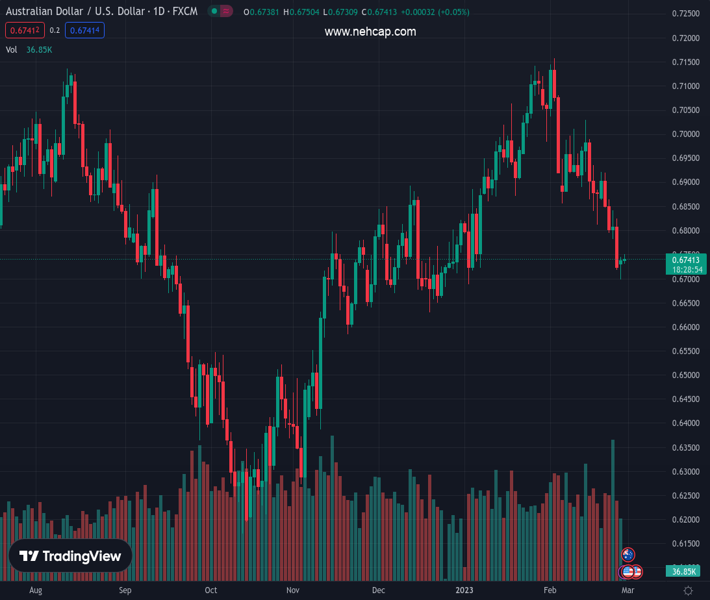
#AUDUSD @ 0.67404 is facing hurdles in stretching its recovery above 0.6750 despite upbeat Australian Retail Sales data. (Pivot Orderbook analysis)
…
This is a premium post.
[s2If !current_user_can(access_s2member_level4)]Please register for PREMIUM VERSION HERE to read full post below containing analysis. In case of any error or you think you are not able to read the full post below, please email us at support#nehcap.com [lwa][/s2If] [s2If current_user_can(access_s2member_level4)]
- AUD/USD is facing hurdles in stretching its recovery above 0.6750 despite upbeat Australian Retail Sales data.
- The Aussie has formed a Hammer candlestick pattern near the crucial support plotted near 0.6710.
- A pullback move to near five-period EMA cannot be ruled out.
The pair currently trades last at 0.67404.
The previous day high was 0.6745 while the previous day low was 0.6698. The daily 38.2% Fib levels comes at 0.6727, expected to provide support. Similarly, the daily 61.8% fib level is at 0.6716, expected to provide support.
The AUD/USD pair is struggling to stretch its recovery above the 0.6750 resistance in the Asian session. A recovery move in the Aussie asset from the round-level support of 0.6700 lacks strength as the risk-off mood has not disappeared yet. The US Dollar Index (DXY) has attempted a recovery after building a cushion around 104.30. However, a sideways performance is widely anticipated after a vertical downside move and ahead of the release of the United States ISM Manufacturing PMI data.
S&P500 futures have added more gains after registering a modest recovery on Monday. The 10-year US Treasury yields are struggling to sustain gains above 3.92%.
The Australian Dollar has failed to find significant bids despite the release of the upbeat monthly Retail Sales (Jan) data. The Australian Bureau of Statistics reported the monthly economic data at 1.9%, higher than the consensus of 1.5%. In December, Retail Sales contracted by 3.9%.
AUD/USD has formed a Hammer candlestick pattern near the crucial support plotted from December 29 low at 0.6710. The formation of Hammer candlestick indicates an emergence of responsive buyers as they consider the asset a ‘value buy’ now after a sheer downside.
It is worth noting that the asset has diverged extremely from the five-period Exponential Moving Average (EMA) at 0.6768. Extremely shorter-term EMAs usually remain sticky with each other. A case of divergence results in a reversion of prices towards the EMA. Therefore, a pullback move cannot be ruled out.
The Relative Strength Index (RSI) (14) has slipped into the bearish range of 20.00-40.00, which favors a downside momentum.
Should the Aussie asset break below Monday’s low around 0.6700, US Dollar bulls will drag the asset towards December 7 low at 0.6668 followed by December 20 low at 0.6629.
On the contrary, a break above February 23 high at 0.6842 will drive the asset toward February 21 high at 0.6920. A break above the latter will expose the major for more upside towards the psychological resistance at 0.7000.
Technical Levels: Supports and Resistances
AUDUSD currently trading at 0.6743 at the time of writing. Pair opened at 0.6739 and is trading with a change of 0.06 % .
| Overview | Overview.1 | |
|---|---|---|
| 0 | Today last price | 0.6743 |
| 1 | Today Daily Change | 0.0004 |
| 2 | Today Daily Change % | 0.0600 |
| 3 | Today daily open | 0.6739 |
The pair is trading below its 20 Daily moving average @ 0.6914, below its 50 Daily moving average @ 0.6894 , above its 100 Daily moving average @ 0.673 and below its 200 Daily moving average @ 0.6799
| Trends | Trends.1 | |
|---|---|---|
| 0 | Daily SMA20 | 0.6914 |
| 1 | Daily SMA50 | 0.6894 |
| 2 | Daily SMA100 | 0.6730 |
| 3 | Daily SMA200 | 0.6799 |
The previous day high was 0.6745 while the previous day low was 0.6698. The daily 38.2% Fib levels comes at 0.6727, expected to provide support. Similarly, the daily 61.8% fib level is at 0.6716, expected to provide support.
Note the levels of interest below:
- Pivot support is noted at 0.671, 0.6681, 0.6663
- Pivot resistance is noted at 0.6757, 0.6774, 0.6803
| Levels | Levels.1 |
|---|---|
| Previous Daily High | 0.6745 |
| Previous Daily Low | 0.6698 |
| Previous Weekly High | 0.6921 |
| Previous Weekly Low | 0.6719 |
| Previous Monthly High | 0.7143 |
| Previous Monthly Low | 0.6688 |
| Daily Fibonacci 38.2% | 0.6727 |
| Daily Fibonacci 61.8% | 0.6716 |
| Daily Pivot Point S1 | 0.6710 |
| Daily Pivot Point S2 | 0.6681 |
| Daily Pivot Point S3 | 0.6663 |
| Daily Pivot Point R1 | 0.6757 |
| Daily Pivot Point R2 | 0.6774 |
| Daily Pivot Point R3 | 0.6803 |
[/s2If]
Join Our Telegram Group


