Asian stocks have found a cushion as the Fed is set to trim the policy tightening pace. (Pivot Orderbook analysis)
…
This is a premium post.
[s2If !current_user_can(access_s2member_level4)]Please register for PREMIUM VERSION HERE to read full post below containing analysis. In case of any error or you think you are not able to read the full post below, please email us at support#nehcap.com [lwa][/s2If] [s2If current_user_can(access_s2member_level4)]
- Asian stocks have found a cushion as the Fed is set to trim the policy tightening pace.
- Chinese equities are showing strength despite the Caixin Manufacturing PMI missed estimates.
- The announcement of the Union Budget by Indian FM will escalate volatility in the Nifty50 index.
The pair currently trades last at 27537.21.
The previous day high was 27538.86 while the previous day low was 27234.03. The daily 38.2% Fib levels comes at 27422.41, expected to provide support. Similarly, the daily 61.8% fib level is at 27350.48, expected to provide support.
Markets in the Asian domain are mildly positive as investors are capitalizing on the context of a further slowdown in the policy tightening pace by the Federal Reserve (Fed). Investors are shrugging off rising United States recession fears, which has provided a cushion to global equities. S&P500 futures are showing losses in early Asia after a bullish session on Tuesday. The US Dollar Index (DXY) is displaying topsy-turvy moves in a 101.70-101.80 range, portraying ambiguity in the sentiment of the market participants.
At the press time, Japan’s Nikkei225 added 0.10%, SZSE Component gained 0.40%, Hang Seng jumped 0.42%, and Nifty50 climbed 0.72%.
Chinese stocks are showing resilience despite the unimpressive Caixin Manufacturing PMI numbers. The economic data has landed at 49.2 lower than the expectations of 49.5 but higher than the former release of 49.0. The street was expecting a better-than-expected performance after getting positive cues from China’s official Manufacturing PMI data.
Manufacturing activities in the Chinese economy in January remained steady despite households celebrating the Lunar New Year festival.
The Nifty50 index is likely to remain extremely volatile as Indian Finance Minister Nirmala Sitharaman will dictate the Union Budget for FY2023-24. Defence and infrastructure stocks are likely to remain on the radar. Meanwhile, the US and India have come into a partnership to launch US-India Initiative on Critical and Emerging Technologies to compete against China on military equipment, semiconductors, and artificial intelligence (AI), as reported by Reuters.
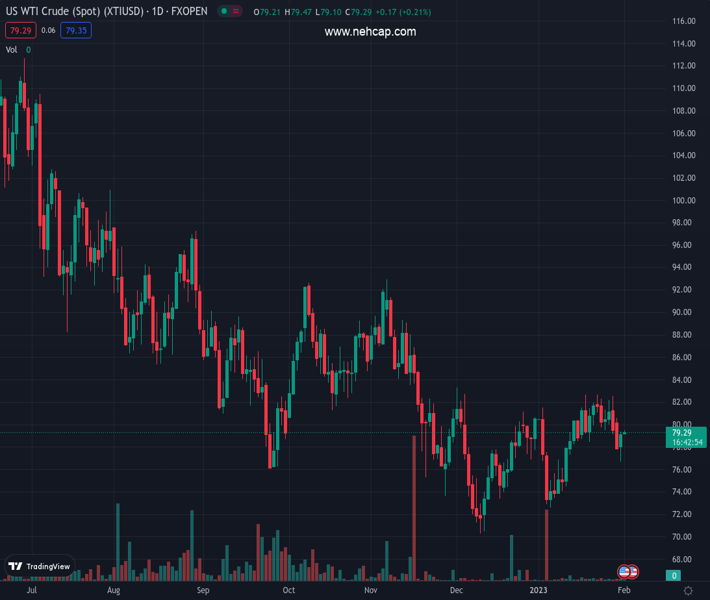
On the oil front, oil prices have recovered dramatically as the Chinese economy is showing resilience after dismantling pandemic controls. The oil price witnessed a stellar buying interest after dropping below $77.00 and is now looking to extend its upside move above the immediate resistance of $79.50.
Technical Levels: Supports and Resistances
XTIUSD currently trading at 27537.21 at the time of writing. Pair opened at 27537.21 and is trading with a change of 0.0 % .
| Overview | Overview.1 | |
|---|---|---|
| 0 | Today last price | 27537.21 |
| 1 | Today Daily Change | 0.00 |
| 2 | Today Daily Change % | 0.00 |
| 3 | Today daily open | 27537.21 |
The pair remains strongly bullish on the daily timeframe. It trades above its 20 SMA @ 26647.98, 50 SMA 27022.95, 100 SMA @ 27164.76 and 200 SMA @ 27220.19.
| Trends | Trends.1 | |
|---|---|---|
| 0 | Daily SMA20 | 26647.98 |
| 1 | Daily SMA50 | 27022.95 |
| 2 | Daily SMA100 | 27164.76 |
| 3 | Daily SMA200 | 27220.19 |
The previous day high was 27538.86 while the previous day low was 27234.03. The daily 38.2% Fib levels comes at 27422.41, expected to provide support. Similarly, the daily 61.8% fib level is at 27350.48, expected to provide support.
Note the levels of interest below:
- Pivot support is noted at 27334.54, 27131.87, 27029.71
- Pivot resistance is noted at 27639.37, 27741.53, 27944.2
| Levels | Levels.1 |
|---|---|
| Previous Daily High | 27538.86 |
| Previous Daily Low | 27234.03 |
| Previous Weekly High | 27561.03 |
| Previous Weekly Low | 26928.22 |
| Previous Monthly High | 27619.58 |
| Previous Monthly Low | 25549.18 |
| Daily Fibonacci 38.2% | 27422.41 |
| Daily Fibonacci 61.8% | 27350.48 |
| Daily Pivot Point S1 | 27334.54 |
| Daily Pivot Point S2 | 27131.87 |
| Daily Pivot Point S3 | 27029.71 |
| Daily Pivot Point R1 | 27639.37 |
| Daily Pivot Point R2 | 27741.53 |
| Daily Pivot Point R3 | 27944.20 |
[/s2If]
Join Our Telegram Group


