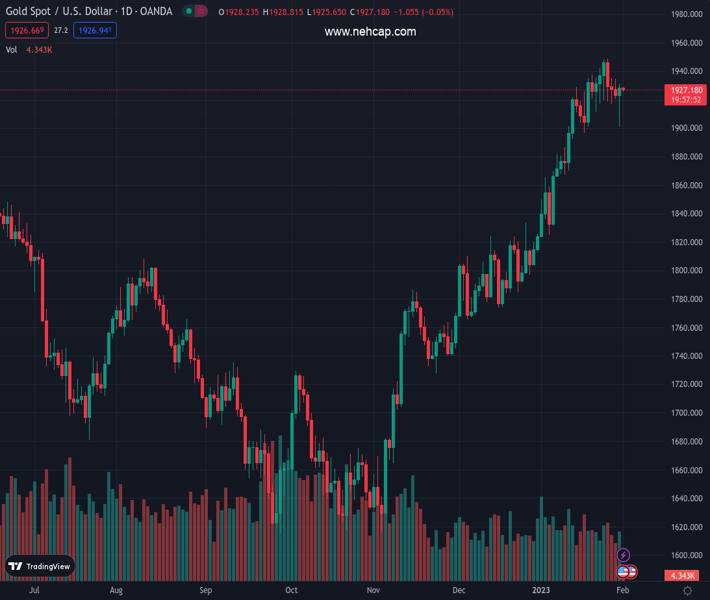
#XAUUSD @ 1,927.04 Gold price has failed in recapturing the critical resistance of $1,930.00 as USD Index rebounds. (Pivot Orderbook analysis)
…
This is a premium post.
[s2If !current_user_can(access_s2member_level4)]Please register for PREMIUM VERSION HERE to read full post below containing analysis. In case of any error or you think you are not able to read the full post below, please email us at support#nehcap.com [lwa][/s2If] [s2If current_user_can(access_s2member_level4)]
- Gold price has failed in recapturing the critical resistance of $1,930.00 as USD Index rebounds.
- The precious metal might continue its upside momentum as the Fed is expected to trim the policy tightening pace.
- Gold price has shown a V-shape recovery after dropping to near the round-level resistance of $1,900.00.
The pair currently trades last at 1927.04.
The previous day high was 1931.15 while the previous day low was 1900.86. The daily 38.2% Fib levels comes at 1919.58, expected to provide support. Similarly, the daily 61.8% fib level is at 1912.43, expected to provide support.
Gold price (XAU/USD) has corrected sharply after failing to recapture the critical resistance of $1,930.00 in the Asian session. The precious metal has witnessed a loss in the upside momentum as the US Dollar Index (DXY) is showing signs of recovery after dropping to near 101.70. The USD Index is gaining traction as investors are getting anxious ahead of the interest rate decision by the Federal Reserve (Fed).
The correction in the Gold price seems mild as Fed chair Jerome Powell is expected to further decelerate the pace of the interest rate hike. Meanwhile, S&P500 futures have eased some gains recorded on Tuesday as investors believe that further interest rate hikes by the Fed will escalate recession fears in the United States. The 10-year US Treasury yields have dropped below 3.52%.
Apart from the Fed’s monetary policy, US Automatic Data Processing (ADP) Employment data and ISM Manufacturing PMI will be of utmost importance. As per the consensus, the US economy has added fresh 170K jobs in January from the former release of 235K. While the Manufacturing PMI is expected to decline to 48.0 against 48.4 released earlier.
For a longer horizon, Reuters noted that higher interest rates by the Fed will limit the Gold price ahead. According to the Reuters poll, Gold price is expected to average $1,852.50 in 2023 and $1,890 in 2024.
Gold price has shown a V-shape recovery after dropping to near the round-level resistance of $1,900.00 on an hourly scale. The precious metal has managed to shift its action above the horizontal resistance, which has become a support now, plotted from January 24 low at $1,914.19.
A bull cross, represented by the 20-and 50-period Exponential Moving Averages (EMAs) at $1,924.06, adds to the upside filters.
However, the Relative Strength Index (RSI) (14) still needs to show a confident bullish range shift for upside momentum.
Technical Levels: Supports and Resistances
XAUUSD currently trading at 1928.22 at the time of writing. Pair opened at 1928.47 and is trading with a change of -0.01 % .
| Overview | Overview.1 | |
|---|---|---|
| 0 | Today last price | 1928.22 |
| 1 | Today Daily Change | -0.25 |
| 2 | Today Daily Change % | -0.01 |
| 3 | Today daily open | 1928.47 |
The pair remains strongly bullish on the daily timeframe. It trades above its 20 SMA @ 1905.58, 50 SMA 1836.67, 100 SMA @ 1759.53 and 200 SMA @ 1775.72.
| Trends | Trends.1 | |
|---|---|---|
| 0 | Daily SMA20 | 1905.58 |
| 1 | Daily SMA50 | 1836.67 |
| 2 | Daily SMA100 | 1759.53 |
| 3 | Daily SMA200 | 1775.72 |
The previous day high was 1931.15 while the previous day low was 1900.86. The daily 38.2% Fib levels comes at 1919.58, expected to provide support. Similarly, the daily 61.8% fib level is at 1912.43, expected to provide support.
Note the levels of interest below:
- Pivot support is noted at 1909.17, 1889.87, 1878.88
- Pivot resistance is noted at 1939.46, 1950.45, 1969.75
| Levels | Levels.1 |
|---|---|
| Previous Daily High | 1931.15 |
| Previous Daily Low | 1900.86 |
| Previous Weekly High | 1949.27 |
| Previous Weekly Low | 1911.45 |
| Previous Monthly High | 1949.27 |
| Previous Monthly Low | 1823.76 |
| Daily Fibonacci 38.2% | 1919.58 |
| Daily Fibonacci 61.8% | 1912.43 |
| Daily Pivot Point S1 | 1909.17 |
| Daily Pivot Point S2 | 1889.87 |
| Daily Pivot Point S3 | 1878.88 |
| Daily Pivot Point R1 | 1939.46 |
| Daily Pivot Point R2 | 1950.45 |
| Daily Pivot Point R3 | 1969.75 |
[/s2If]
Join Our Telegram Group


