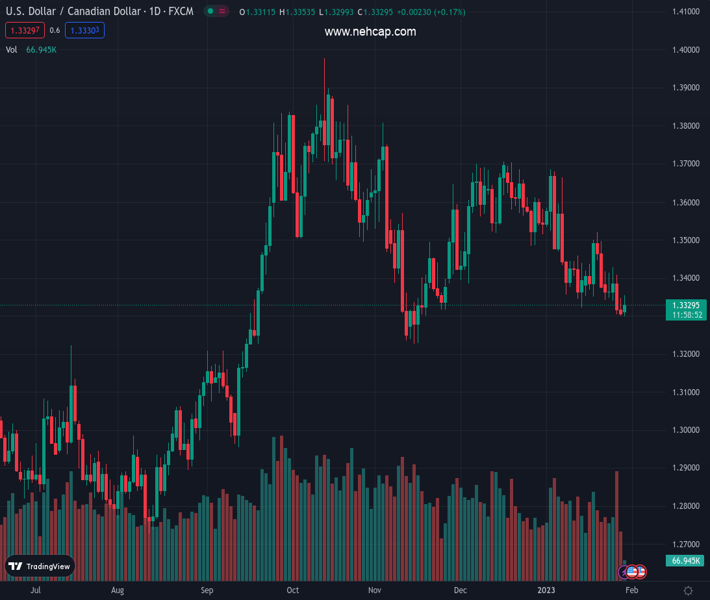
#USDCAD @ 1.33288 stages a modest recovery from over a two-month low touched earlier this Monday. (Pivot Orderbook analysis)
…
This is a premium post.
[s2If !current_user_can(access_s2member_level4)]Please register for PREMIUM VERSION HERE to read full post below containing analysis. In case of any error or you think you are not able to read the full post below, please email us at support#nehcap.com [lwa][/s2If] [s2If current_user_can(access_s2member_level4)]
- USD/CAD stages a modest recovery from over a two-month low touched earlier this Monday.
- A softer tone around crude oil prices undermines the Loonie and acts as a tailwind for the pair.
- Subdued USD price action holds back bulls from placing aggressive bets and caps the upside.
The pair currently trades last at 1.33288.
The previous day high was 1.3347 while the previous day low was 1.33. The daily 38.2% Fib levels comes at 1.3318, expected to provide support. Similarly, the daily 61.8% fib level is at 1.3329, expected to provide resistance.
The USD/CAD pair attracts some buyers near the 1.3300 mark and stages a goodish intraday bounce from over a two-month low touched earlier this Monday. The pair sticks to the recovery gains through the first half of the European session and is currently placed near the top end of the daily range, just below mid-1.3300s.
Crude oil prices remain depressed for the second straight day, which, in turn, is seen undermining the commodity-linked Loonie and acting as a tailwind for the USD/CAD pair. An indication of a rise in crude exports from Russia’s Baltic ports in early February, to a larger extent, offsets the optimism over a demand recovery in China. Adding to this, expectations that OPEC+ will likely keep output unchanged during a meeting this week weighs on the black liquid.
The upside for the USD/CAD pair, meanwhile, seems capped amid the underlying bearish sentiment around the US Dollar. The prospects for a less aggressive policy tightening by the Fed keep the USD bulls on the defensive near a nine-month low touched last week. Traders, however, seem reluctant and prefer to move to the sidelines ahead of the highly-anticipated FOMC monetary policy decision, scheduled to be announced at the end of a two-day meeting on Wednesday.
In the absence of any relevant market-moving economic releases, either from the US or Canada on Monday, the aforementioned fundamental backdrop warrants caution before placing directional bets. Nevertheless, the USD/CAD pair, for now, manages to hold above the 1.3300 round-figure mark and remains at the mercy of the USD/oil price dynamics. The said handle could act as a pivotal point, which if broken decisively should pave the way for a further near-term depreciating move.
Technical Levels: Supports and Resistances
USDCAD currently trading at 1.3337 at the time of writing. Pair opened at 1.3312 and is trading with a change of 0.19 % .
| Overview | Overview.1 | |
|---|---|---|
| 0 | Today last price | 1.3337 |
| 1 | Today Daily Change | 0.0025 |
| 2 | Today Daily Change % | 0.1900 |
| 3 | Today daily open | 1.3312 |
The pair is trading below its 20 Daily moving average @ 1.3433, below its 50 Daily moving average @ 1.3503 , below its 100 Daily moving average @ 1.3525 and above its 200 Daily moving average @ 1.3208
| Trends | Trends.1 | |
|---|---|---|
| 0 | Daily SMA20 | 1.3433 |
| 1 | Daily SMA50 | 1.3503 |
| 2 | Daily SMA100 | 1.3525 |
| 3 | Daily SMA200 | 1.3208 |
The previous day high was 1.3347 while the previous day low was 1.33. The daily 38.2% Fib levels comes at 1.3318, expected to provide support. Similarly, the daily 61.8% fib level is at 1.3329, expected to provide resistance.
Note the levels of interest below:
- Pivot support is noted at 1.3293, 1.3273, 1.3246
- Pivot resistance is noted at 1.3339, 1.3366, 1.3385
| Levels | Levels.1 |
|---|---|
| Previous Daily High | 1.3347 |
| Previous Daily Low | 1.3300 |
| Previous Weekly High | 1.3428 |
| Previous Weekly Low | 1.3300 |
| Previous Monthly High | 1.3705 |
| Previous Monthly Low | 1.3385 |
| Daily Fibonacci 38.2% | 1.3318 |
| Daily Fibonacci 61.8% | 1.3329 |
| Daily Pivot Point S1 | 1.3293 |
| Daily Pivot Point S2 | 1.3273 |
| Daily Pivot Point S3 | 1.3246 |
| Daily Pivot Point R1 | 1.3339 |
| Daily Pivot Point R2 | 1.3366 |
| Daily Pivot Point R3 | 1.3385 |
[/s2If]
Join Our Telegram Group


