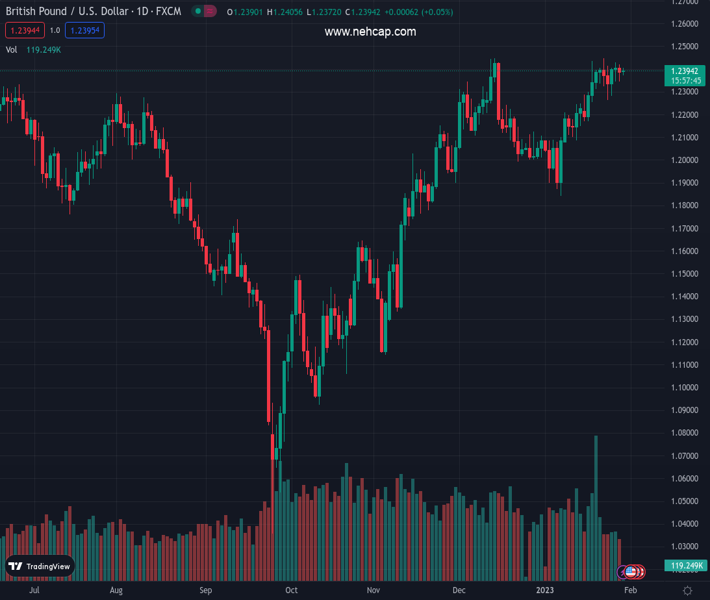
#GBPUSD @ 1.23936 has printed a fresh day’s high above 1.2400 amid sheer volatility in the USD Index. (Pivot Orderbook analysis)
…
This is a premium post.
[s2If !current_user_can(access_s2member_level4)]Please register for PREMIUM VERSION HERE to read full post below containing analysis. In case of any error or you think you are not able to read the full post below, please email us at support#nehcap.com [lwa][/s2If] [s2If current_user_can(access_s2member_level4)]
- GBP/USD has printed a fresh day’s high above 1.2400 amid sheer volatility in the USD Index.
- The Federal Reserve might pause hiking interest rates after pushing them into a 4.75-5.00% range.
- A continuation of bigger interest rate hikes is expected from the BoE as the UK inflation is still in the double-digit figure.
- GBP/USD is on the verge of delivering a volatility contraction despite the souring market mood.
The pair currently trades last at 1.23936.
The previous day high was 1.2419 while the previous day low was 1.2346. The daily 38.2% Fib levels comes at 1.2374, expected to provide support. Similarly, the daily 61.8% fib level is at 1.2391, expected to provide support.
The GBP/USD pair has refreshed its day’s high at 1.2405 in the early European session. The Cable has picked up strength as the US Dollar Index (DXY) has turned extremely volatile amid chatters over the interest rate decision by the Federal Reserve (Fed) and the Bank of England (BoE) this week. The USD Index has displayed a wild gyration in a 101.40-101.57 range and is demonstrating a downside bias as investors are punishing the safe-haven asset amid rising bets for a smaller interest rate hike by the Federal Reserve ahead.
S&P500 futures have extended their losses as consumer spending has fallen 0.2% in December, as reported by the United States Commerce Department. A decline in consumer spending is indicating weaker earnings projections for the US equities, which has turned investors risk-averse. The demand for US government bonds is escalating on expectations of lower terminal rate projections for CY2023 than previously anticipated.
The United States Consumer Price Index (CPI) is declining significantly as higher interest rates by the Federal Reserve (Fed) have trimmed retail demand. The decline in the Federal Reserve’s most preferred inflation tool Personal Consumption Expenditure (PCE) Price Index to 4.4%, in line with expectations. The PCE Price Index data was already expected lower as Producer Price Index (PPI) for December has already been trimmed and consumer spending has also tumbled.
Declining inflation projections have bolstered the expectations of a smaller interest rate hike announcement by Federal Reserve chair Jerome Powell. Analysts at Rabobank point out that it has become increasingly likely that the Fed will slow down its hiking cycle to 25 bps. For the interest rate guidance “We continue to think that based on the fading momentum of inflation, the Federal Open Market Committee (FOMC) is likely to stop at a 4.75-5.00% target range and pause for the remainder of the year.”
Before the release of the first monetary policy of CY2023 by the Federal Reserve, investors will also keep the United States Automatic Data Processing (ADP) Employment data and ISM Manufacturing PMI on the radar, which will release on Wednesday. Higher interest rates by the Federal Reserve to tame soaring inflation has brought a stagnancy in the operations of various firms, which has forced them to scale down their recruitment process.
First and foremost, investors are awaiting the release of the US ADP Employment, which is seen lower at 86K, significantly lower than the former release of 235K. A decline in consumer spending and higher interest payment obligations have forced firms to avoid borrowing.
Apart from that, the US ISM Manufacturing PMI is seen lower at 48.2 vs. the former release of 48.4 as firms are not operating at their full capacity due to weaker demand.
The Bank of England is worried about its double-digit inflation despite being the early adopter of hawkish monetary policy after the pandemic period. The rising labor cost index and food prices have offset the impact of softened energy prices in the United Kingdom. Bank of England Governor Andrew Bailey has already increased interest rates to 3.50% and the United Kingdom’s double-digit inflation is likely to call for a continuation of a higher interest rate hike. According to a poll from Reuters, Investors are mostly betting on another half percentage-point increase to 4.0% and that Bank Rate will peak at 4.5% soon.
GBP/USD is auctioning in an Ascending Triangle chart pattern on an hourly chart that indicates a sheer squeeze in volatility. The upward-sloping trendline of the aforementioned chart is placed from January 12 low at 1.2089 while the horizontal resistance is plotted from January 18 high around 1.2436. Inside the broader Ascending Triangle, the Cable is also forming a Descending Triangle, which indicates massive volatility contraction. The Pound Sterling is near the downward-sloping trendline of the Descending Triangle and is expected to deliver a breakout sooner.
The asset has climbed above the 20-period Exponential Moving Average (EMA) at 1.2392, which conveys a bullish short-term bias.
Meanwhile, the Relative Strength Index (RSI) (14) is attempting to shift into the bullish range of 60.00-80.00, which will trigger the bullish momentum ahead.
Technical Levels: Supports and Resistances
GBPUSD currently trading at 1.2399 at the time of writing. Pair opened at 1.2391 and is trading with a change of 0.06 % .
| Overview | Overview.1 | |
|---|---|---|
| 0 | Today last price | 1.2399 |
| 1 | Today Daily Change | 0.0008 |
| 2 | Today Daily Change % | 0.0600 |
| 3 | Today daily open | 1.2391 |
The pair remains strongly bullish on the daily timeframe. It trades above its 20 SMA @ 1.2226, 50 SMA 1.2163, 100 SMA @ 1.1766 and 200 SMA @ 1.1963.
| Trends | Trends.1 | |
|---|---|---|
| 0 | Daily SMA20 | 1.2226 |
| 1 | Daily SMA50 | 1.2163 |
| 2 | Daily SMA100 | 1.1766 |
| 3 | Daily SMA200 | 1.1963 |
The previous day high was 1.2419 while the previous day low was 1.2346. The daily 38.2% Fib levels comes at 1.2374, expected to provide support. Similarly, the daily 61.8% fib level is at 1.2391, expected to provide support.
Note the levels of interest below:
- Pivot support is noted at 1.2351, 1.2312, 1.2278
- Pivot resistance is noted at 1.2425, 1.2459, 1.2498
| Levels | Levels.1 |
|---|---|
| Previous Daily High | 1.2419 |
| Previous Daily Low | 1.2346 |
| Previous Weekly High | 1.2448 |
| Previous Weekly Low | 1.2263 |
| Previous Monthly High | 1.2447 |
| Previous Monthly Low | 1.1992 |
| Daily Fibonacci 38.2% | 1.2374 |
| Daily Fibonacci 61.8% | 1.2391 |
| Daily Pivot Point S1 | 1.2351 |
| Daily Pivot Point S2 | 1.2312 |
| Daily Pivot Point S3 | 1.2278 |
| Daily Pivot Point R1 | 1.2425 |
| Daily Pivot Point R2 | 1.2459 |
| Daily Pivot Point R3 | 1.2498 |
[/s2If]
Join Our Telegram Group


