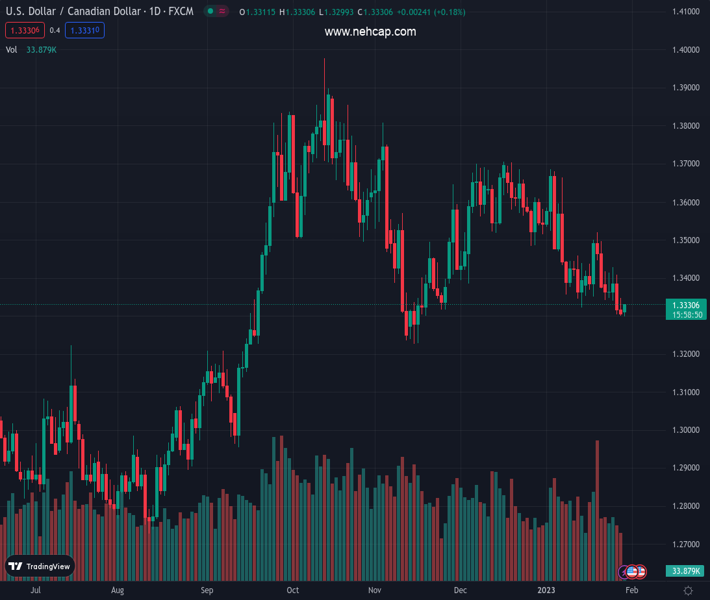
#USDCAD @ 1.33297 keeps bounce off 2.5-month low while snapping two-day downtrend. (Pivot Orderbook analysis)
…
This is a premium post.
[s2If !current_user_can(access_s2member_level4)]Please register for PREMIUM VERSION HERE to read full post below containing analysis. In case of any error or you think you are not able to read the full post below, please email us at support#nehcap.com [lwa][/s2If] [s2If current_user_can(access_s2member_level4)]
- USD/CAD keeps bounce off 2.5-month low while snapping two-day downtrend.
- Shift in market sentiment exerts downside pressure on Oil price, favors US Dollar.
- China-linked headlines entertain traders amid a light calendar.
- Fed’s dovish hike, softer NFP appears necessary for bears to keep the reins.
The pair currently trades last at 1.33297.
The previous day high was 1.3347 while the previous day low was 1.33. The daily 38.2% Fib levels comes at 1.3318, expected to provide support. Similarly, the daily 61.8% fib level is at 1.3329, expected to provide support.
USD/CAD picks up bids to refresh intraday high around 1.3325 during the first positive day in three heading into Monday’s European session. In doing so, the Loonie pair takes clues from the downbeat Oil prices, Canada’s main export, as well as a rebound in the US Dollar amid the market’s cautious optimism.
That said, WTI crude oil takes offers to refresh intraday low near $79.50 as early Asian session optimism, mainly led by China’s return from the one-week-long Lunar New Year (LNY) holidays, fades amid mixed concerns.
Also challenging the Oil price could be the US Dollar Index (DXY) rebound from the intraday low while ignoring the US Treasury bond yields. That said, the DXY prints a three-day uptrend near 102.00 but the US 10-year Treasury bond yields retreat from daily tops to 3.50% after the Japanese panel teases hawkish moves of the Bank of Japan (BOJ).
Elsewhere, Bloomberg poured cold water on the face of expectations that the holiday season propelled China activities. The analysis stated a few signs of improvement in the Chinese economy despite its second month without Covid Zero curbs. The research, however, marks the Lunar New Year (LNY) holiday season as marking a lid on some activities.
Against this backdrop, the US Treasury bond yields retreat from the intraday top but the stock futures print mild losses. Furthermore, the Asia-Pacific shares grind higher and the US Dollar Index (DXY) defends a two-day recovery.
Looking forward, risk catalysts are likely to determine short-term market moves ahead of Wednesday’s Federal Open Market Committee (FOMC) and Friday’s US jobs report for January. It’s worth noting that headlines surrounding China are an extra burden on the USD/CAD watchers to determine near-term moves.
A four-day-old bearish triangle restricts USD/CAD moves between 1.3290 and 1.3330.
Technical Levels: Supports and Resistances
USDCAD currently trading at 1.3327 at the time of writing. Pair opened at 1.3312 and is trading with a change of 0.11% % .
| Overview | Overview.1 | |
|---|---|---|
| 0 | Today last price | 1.3327 |
| 1 | Today Daily Change | 0.0015 |
| 2 | Today Daily Change % | 0.11% |
| 3 | Today daily open | 1.3312 |
The pair is trading below its 20 Daily moving average @ 1.3433, below its 50 Daily moving average @ 1.3503 , below its 100 Daily moving average @ 1.3525 and above its 200 Daily moving average @ 1.3208
| Trends | Trends.1 | |
|---|---|---|
| 0 | Daily SMA20 | 1.3433 |
| 1 | Daily SMA50 | 1.3503 |
| 2 | Daily SMA100 | 1.3525 |
| 3 | Daily SMA200 | 1.3208 |
The previous day high was 1.3347 while the previous day low was 1.33. The daily 38.2% Fib levels comes at 1.3318, expected to provide support. Similarly, the daily 61.8% fib level is at 1.3329, expected to provide support.
Note the levels of interest below:
- Pivot support is noted at 1.3293, 1.3273, 1.3246
- Pivot resistance is noted at 1.3339, 1.3366, 1.3385
| Levels | Levels.1 |
|---|---|
| Previous Daily High | 1.3347 |
| Previous Daily Low | 1.3300 |
| Previous Weekly High | 1.3428 |
| Previous Weekly Low | 1.3300 |
| Previous Monthly High | 1.3705 |
| Previous Monthly Low | 1.3385 |
| Daily Fibonacci 38.2% | 1.3318 |
| Daily Fibonacci 61.8% | 1.3329 |
| Daily Pivot Point S1 | 1.3293 |
| Daily Pivot Point S2 | 1.3273 |
| Daily Pivot Point S3 | 1.3246 |
| Daily Pivot Point R1 | 1.3339 |
| Daily Pivot Point R2 | 1.3366 |
| Daily Pivot Point R3 | 1.3385 |
[/s2If]
Join Our Telegram Group


